Uranium Miners ETF (URA) remains bullish against April 2025 low

The Global X Uranium ETF ($URA) is an exchange-traded fund designed to provide investors with exposure to the uranium mining industry. It tracks the performance of the Solactive Global Uranium & Nuclear Components Total Return Index. This includes companies involved in uranium mining, exploration, and nuclear energy production. Launched in 2010, $URA offers a diversified way to invest in the growing demand for uranium, driven by the global push for clean energy and nuclear power.
URA Elliott Wave chart monthly chart
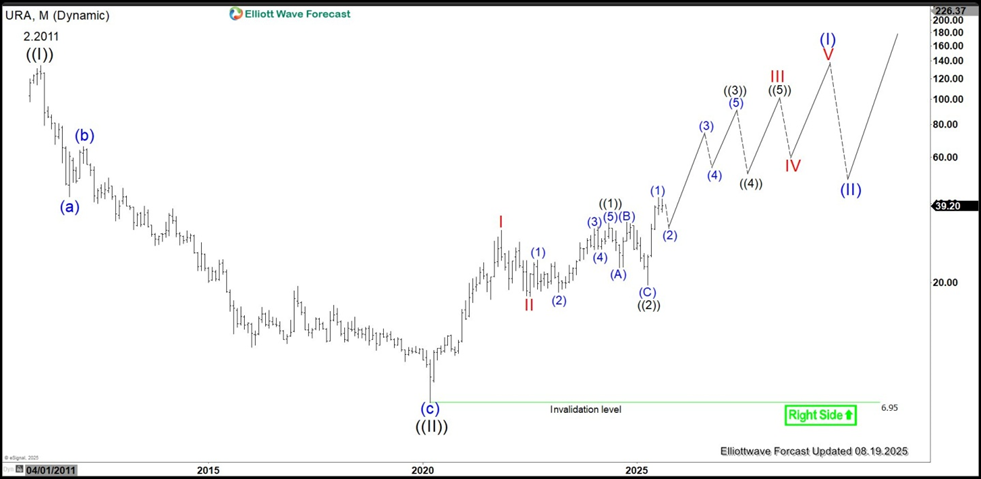
The monthly chart of the URA ETF indicates it bottomed out at 6.95. This marks the completion of a major corrective phase in the Grand Super Cycle wave ((II)). Since that low, the ETF has been advancing in a strong, impulsive pattern. Starting from the March 18, 2020 low, the initial upward move peaked at 31.60 in wave I. A corrective pullback wave II followed which ended at 17.65. The ETF then entered a robust wave III, which is developing in a five-wave structure of a smaller degree. From the prior low, the first sub-wave ((1)) hit 33.66, with the subsequent correction wave ((2)) finding a base at 19.50. As long as the 6.95 level remains intact, the URA ETF is poised to continue its upward trend.
URA daily Elliott Wave chart
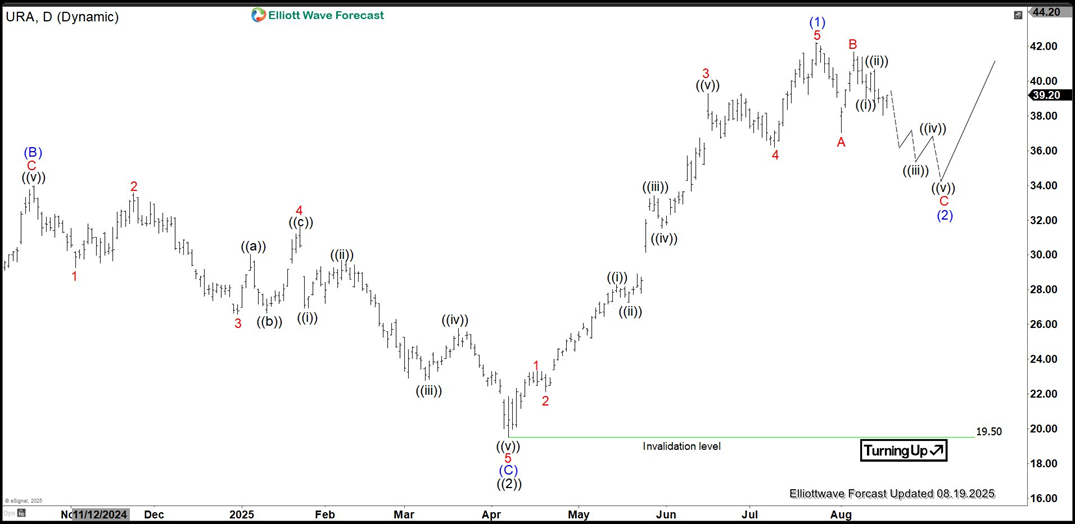
The daily chart of the $URA ETF indicates that a corrective wave ((2)) concluded at 19.5, tracing an expanded flat pattern. In this structure, the initial decline in wave (A) reached 22.79, followed by a rally in wave (B) to 33.99. The subsequent wave (C) dropped to 19.50, finalizing wave ((2)). Since that low, the ETF has progressed in a clear impulsive sequence.
From the wave ((2)) low, the first wave peaked at 23.31, with a corrective wave 2 finding support at 22.12. The third wave surged to 39.30, followed by a wave 4 pullback that bottomed at 36.20. The fifth wave culminated at 42.22, completing wave (1) of a higher degree. Currently, the ETF is undergoing a correction from the April 7, 2025 low in wave (2), with expectations of resuming its upward trend. As long as the 19.50 pivot holds, any pullback is likely to find support in a 3, 7, or 11-swing structure, setting the stage for further gains.
Author

Elliott Wave Forecast Team
ElliottWave-Forecast.com