UK Preliminary GDP grows by 0.4% QoQ in Q2, as expected

The UK economy expanded at a quarterly rate of 0.4% in the three months to June 2026, following a 0.6% growth in the first quarter (Q1). The data came in line with the market forecast.
The UK GDP grew 1.2% year-over-year (YoY) in Q2 2026 vs. 1.1% expected and a 0.9% growth in Q1.
The monthly UK GDP arrived at 0.3% in June, compared to 0% in May (revised from 0.1%), above the market consensus of a 0%.
Other data from the UK showed that Industrial Production declined 0.2% over the month in June, while the Manufacturing Production fell 0.5% MoM during the same period. Both readings came in weaker than market expectations.
Market reaction to the UK data
The UK GDP data fails to boost the British Pound. At the press time, the GBP/USD pair is up 0.01% on the day to trade at 1.3495.
(This story was corrected on August 13 at 06:40 GMT to fix that the UK Preliminary GDP grows by 0.4% QoQ in Q2, as expected, not 0.6%.)
Pound Sterling Price This week
The table below shows the percentage change of British Pound (GBP) against listed major currencies this week. British Pound was the strongest against the New Zealand Dollar.
| USD | EUR | GBP | JPY | CAD | AUD | NZD | CHF | |
|---|---|---|---|---|---|---|---|---|
| USD | 0.27% | -0.04% | 1.00% | -0.01% | 0.19% | 1.04% | 0.76% | |
| EUR | -0.27% | -0.32% | 0.70% | -0.38% | -0.13% | 0.67% | 0.39% | |
| GBP | 0.04% | 0.32% | 0.97% | -0.06% | 0.18% | 0.99% | 0.69% | |
| JPY | -1.00% | -0.70% | -0.97% | -0.70% | -0.46% | 0.21% | -0.03% | |
| CAD | 0.00% | 0.38% | 0.06% | 0.70% | 0.24% | 0.91% | 0.82% | |
| AUD | -0.19% | 0.13% | -0.18% | 0.46% | -0.24% | 0.81% | 0.50% | |
| NZD | -1.04% | -0.67% | -0.99% | -0.21% | -0.91% | -0.81% | -0.29% | |
| CHF | -0.76% | -0.39% | -0.69% | 0.03% | -0.82% | -0.50% | 0.29% |
The heat map shows percentage changes of major currencies against each other. The base currency is picked from the left column, while the quote currency is picked from the top row. For example, if you pick the British Pound from the left column and move along the horizontal line to the US Dollar, the percentage change displayed in the box will represent GBP (base)/USD (quote).
This section below was published at 02:00 GMT on Thursday as a preview of the UK GDP data.
- The United Kingdom Q2 Gross Domestic Product is expected to show moderate quarterly growth.
- The GDP is forecast to expand in the three months to June, despite geopolitical noise.
- The GBP/USD pair is technically bullish and can reach 1.3600 on an upbeat GDP outcome.
The United Kingdom’s (UK) Office for National Statistics will release the preliminary estimate of the second-quarter Gross Domestic Product (GDP) on Thursday. Market analysts anticipate a 0.4% growth in the three months to June, after a modest 0.6% advance in the first quarter of 2026. Annual progress is expected at 1.1%, up from the 0.9% posted in March.
As usual, preliminary GDP estimates will have a large impact on the British Pound (GBP), though they are subject to revisions over the next couple of months. The GDP figures will be released alongside a myriad of other figures, including the Goods Trade Balance and Industrial and Manufacturing Production. Generally speaking, market participants anticipate tepid outcomes, as the ongoing war in the Middle East takes its toll.
UK Gross Domestic Product forecast: What numbers could tell us
The anticipated tepid UK economic progress is directly linked to a slowdown in consumer spending, driven by tighter credit conditions and weak real wage growth. Generally speaking, the figures are expected to weigh on the British Pound, though the impact may be mitigated if the outcome meets expectations.
Economic growth is not part of the Bank of England (BoE) mandate, but GDP developments are clearly correlated with monetary policy. The BoE left its key interest rate unchanged at 3.75%, in line with economists’ expectations when it met early in July. The Monetary Policy Committee (MPC), however, was divided, with three ouf ot nine members voting to lift the Bank Rate by 25 basis points. Policymakers agreed that inflation risks remain skewed to the upside, with pressure coming from higher energy prices, the latter of which is the result of the war in the Middle East.
Market players are betting on additional interest rate hikes in the near future, yet keeping the policy rate above the neutral range is unsustainable without economic progress. A poor GDP reading, then, should suggest no changes to interest rates and hence drag the GBP lower. The opposite scenario is also valid, with stronger-than-anticipated figures providing GBP with a near-term boost.
There is still one more sticky factor to consider in this equation: inflation. The Consumer Prices Index including owner occupiers' housing costs (CPIH) rose by 2.8% in the 12 months to June 2026, down from 3% the previous month. Indeed, inflation decreased globally in June, as market players were hopeful the United States (US) and Iran would be able to clinch a deal. The Memorandum of Understanding (MoU) that called for a truce between the two conflicting nations pushed Oil prices sharply down in the month, easing inflationary pressures worldwide.
Peace in the Middle East, however, is no longer an option. Tit-for-tat attacks continue, while talks have stalled. Oil prices are back up, although still far from their post-war peaks. Nevertheless, continued tensions around the Strait of Hormuz mean inflationary pressures will likely rise from July on.
When will the UK release Q2 GDP, and how could it affect GBP/USD?
As previously noted, the UK will release the preliminary estimate of Q2 GDP on Thursday at 06:00 GMT. Data is expected to show moderated growth in the three months to June, and a reading within expectations is unlikely to have a relevant impact on GBP/USD.
Ahead of the announcement, the pair trades above the 1.3500 mark, at its highest in roughly a month, as the US Dollar (USD) can’t recover from the poor employment shock in the July Nonfarm Payrolls (NFP) report. The figures weighed on the Federal Reserve (Fed) rate-hike odds, while CPI data on Wednesday showed inflation rose at an annual rate of 3.4% in July, as expected.
Valeria Bednarik, Chief Analyst at FXStreet, notes: “The GBP/USD pair is technically bullish approaching the July monthly high at 1.3558. The Q2 GDP report may introduce some noise, but as long as the pair remains above the 1.3480 price zone, the bullish case will remain in place. A better-than-anticipated outcome is likely to push the pair closer to the 1.3600 mark, although sustained gains around the level would depend on market sentiment and the consequent USD strength or weakness.”
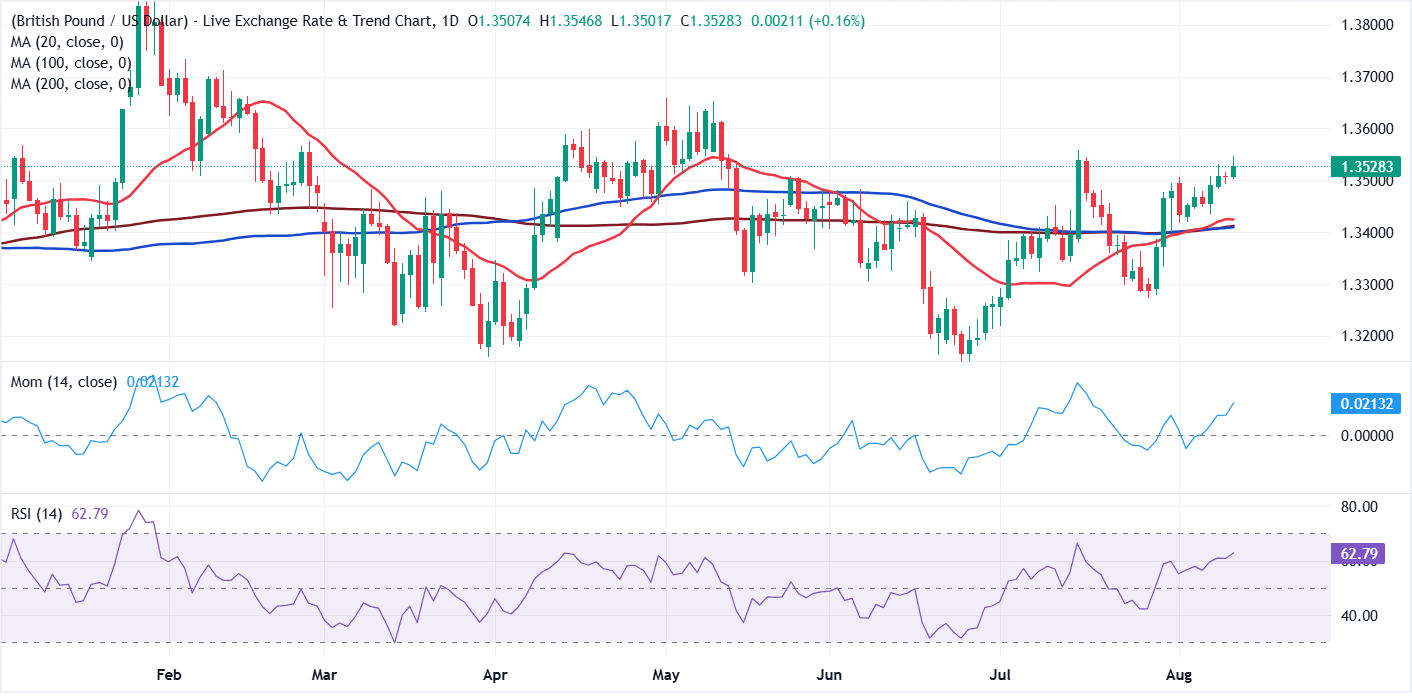
Bednarik adds: “A dismal outcome could push the pair lower, initially towards 1.3480 and later closer to the 1.3400 mark. Once the dust settles, however, speculative interest will return to the usual war-related trading.”
GDP FAQs
A country’s Gross Domestic Product (GDP) measures the rate of growth of its economy over a given period of time, usually a quarter. The most reliable figures are those that compare GDP to the previous quarter e.g Q2 of 2023 vs Q1 of 2023, or to the same period in the previous year, e.g Q2 of 2023 vs Q2 of 2022. Annualized quarterly GDP figures extrapolate the growth rate of the quarter as if it were constant for the rest of the year. These can be misleading, however, if temporary shocks impact growth in one quarter but are unlikely to last all year – such as happened in the first quarter of 2020 at the outbreak of the covid pandemic, when growth plummeted.
A higher GDP result is generally positive for a nation’s currency as it reflects a growing economy, which is more likely to produce goods and services that can be exported, as well as attracting higher foreign investment. By the same token, when GDP falls it is usually negative for the currency. When an economy grows people tend to spend more, which leads to inflation. The country’s central bank then has to put up interest rates to combat the inflation with the side effect of attracting more capital inflows from global investors, thus helping the local currency appreciate.
When an economy grows and GDP is rising, people tend to spend more which leads to inflation. The country’s central bank then has to put up interest rates to combat the inflation. Higher interest rates are negative for Gold because they increase the opportunity-cost of holding Gold versus placing the money in a cash deposit account. Therefore, a higher GDP growth rate is usually a bearish factor for Gold price.
Economic Indicator
Gross Domestic Product (YoY)
The Gross Domestic Product (GDP), released by the Office for National Statistics on a monthly and quarterly basis, is a measure of the total value of all goods and services produced in the UK during a given period. The GDP is considered as the main measure of UK economic activity. The YoY reading compares economic activity in the reference quarter compared with the same quarter a year earlier. Generally speaking, a rise in this indicator is bullish for the Pound Sterling (GBP), while a low reading is seen as bearish.
Read more.Next release: Thu Aug 13, 2026 06:00 (Prel)
Frequency: Quarterly
Consensus: 1.1%
Previous: 0.9%
Source: Office for National Statistics
Author

FXStreet Team
FXStreet
Composed of a group of economic journalists and FX experts, the FXStreet content team produces and oversees all content published on FXStreet. It provides a purely journalistic approach to the Forex market.