|

TSLA wave ((iv)) bounce underway, more downside ahead

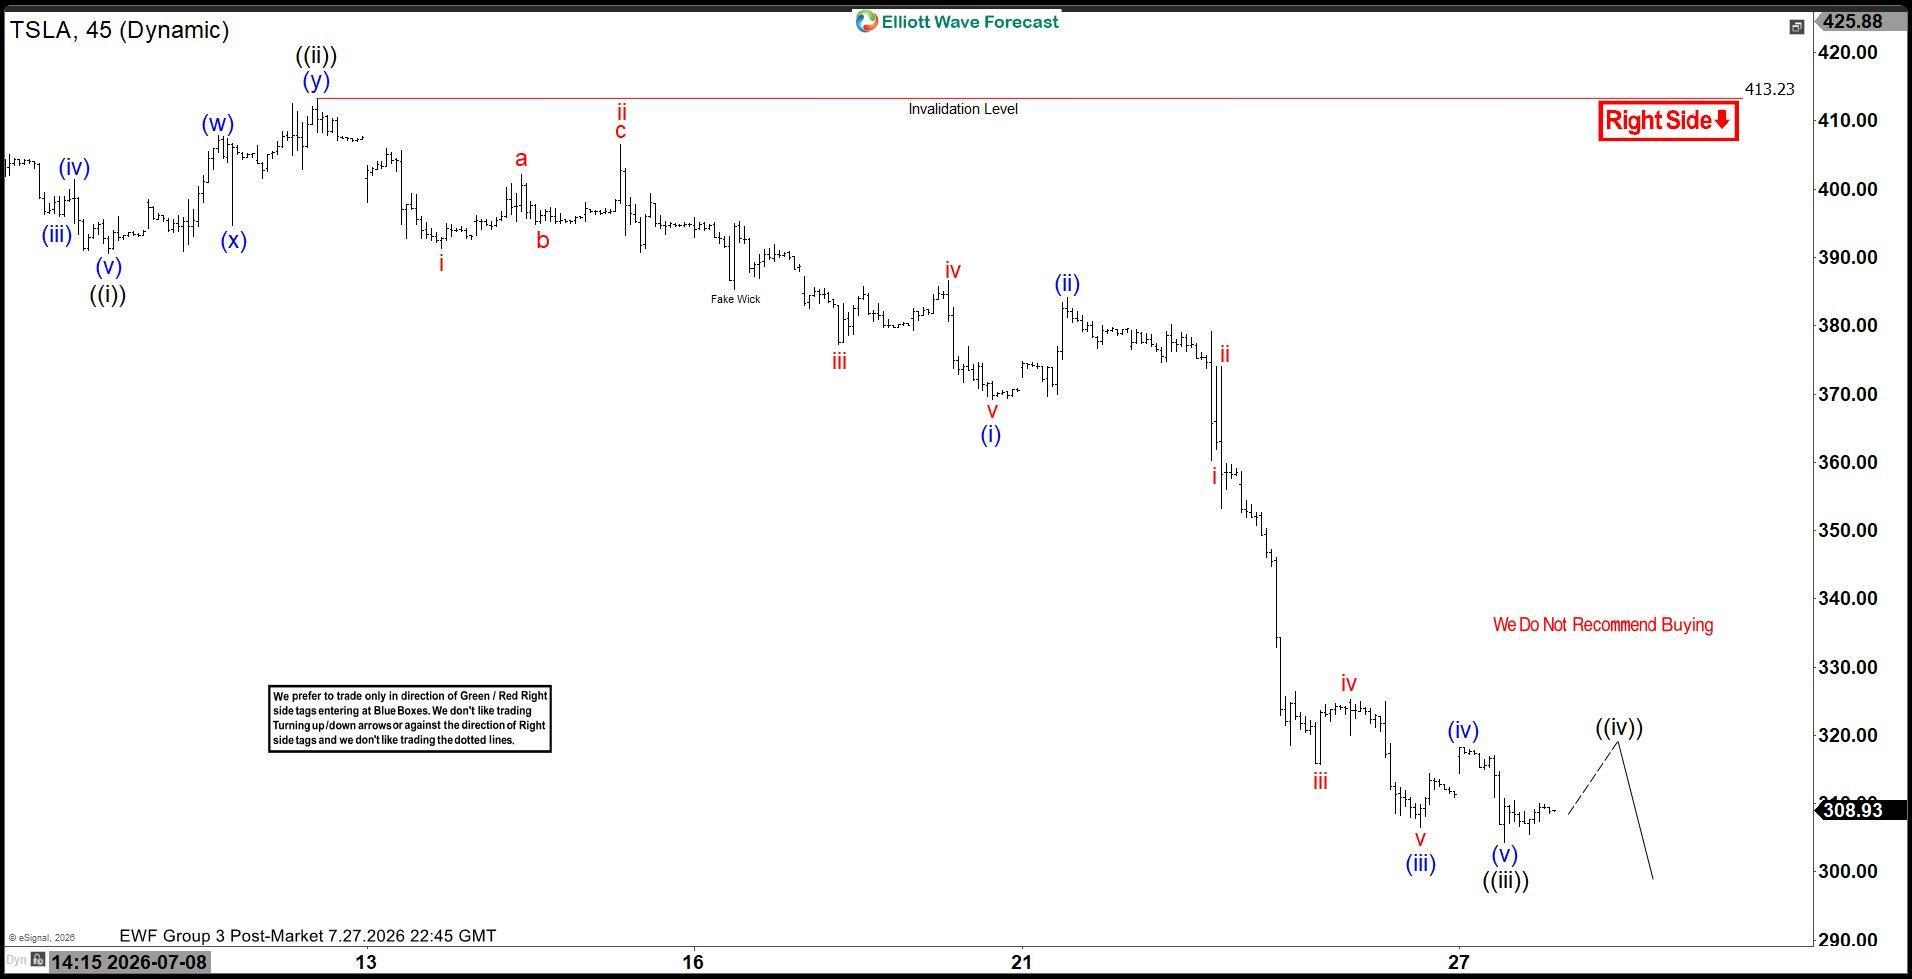
Tesla (TSLA) remains under pressure after turning lower against the 413.23 high on the 1-hour timeframe. Since that peak, the stock has completed a five-wave impulse decline, which we are labeling as wave ((iii)), ending at 304.28. TSLA has now turned higher, suggesting that wave ((iv)) is in progress as a corrective bounce. In the near term, we may see some additional upside as wave ((iv)) develops. However, the current bounce is expected to remain corrective in nature. Once it completes, we expect TSLA to turn lower again and resume the downside sequence. The next decline should complete a higher-degree red wave 3 and further confirm the broader bearish structure.

The 4-hour chart also supports this view. TSLA has been declining from the 453.35 peak, with the recent price action fitting into an impulsive structure. The current wave ((iv)) recovery should offer only a temporary reprieve before the stock resumes lower.

On the bigger timeframe, our bias remains to the downside. We expect it to eventually reach the 290–189 price range as it completes the larger pullback from the 498.83 peak. In the next 24 hours, it may continue higher within wave ((iv)), but we expect the recovery to remain limited below 413.23. After the bounce completes, the stock should turn lower again, keeping the bearish trend intact.

TSLA 45 Min. Elliott Wave Chart
TSLA Elliott Wave Video:
Youtube preview

Author

Elliott Wave Forecast Team

Elliott Wave Forecast Team

ElliottWave-Forecast.com

More from Elliott Wave Forecast Team

Share:

Editor's Picks

GBP/USD remains slightly bid near 1.3300

GBP/USD now advances marginally and manages to dispute the 1.3300 region on Tuesday. Indeed, Cable regains some balance on the back of the lacklustre performance of the Greenback, all preceding the Fed’s meeting on Wednesday and the BoE’s gathering on Thursday.

EUR/USD clings to gains around 1.1400

EUR/USD bounces off earlier multi-week lows and remains close to the 1.1400 region on Tuesday. The pair’s decent advance follows hopes of a more sustainable deal between the US and Iran, which in turn keeps the downside pressure on the US Dollar ahead of the key Fed meeting on Wednesday.

Gold bounces on poor US data

Gold remains under marked downside pressure on Tuesday, although the $4,000 zone per troy ounce emerges as a decent support for now. The precious metal’s pullback comes despite the modest losses in the US Dollar in a context of easing geopolitical tensions ahead of the key Fed event on Wednesday.

Bitcoin slips below $64,000 as risk-off sentiment grips markets
Bitcoin (BTC) is extending its correction, trading below $64,000 at the time of writing on Tuesday after losses of over 2.5% the previous day. Institutional demand shows early signs of weakness, with spot Exchange Traded Funds (ETFs) recording a mild outflow on Monday, marking three consecutive days of withdrawals.
Indian Rupee outlook: Downtrend set to persist – Just at a slower pace
The Indian Rupee just endured its most brutal six-month stretch in years, battered by a perfect storm of global shocks. From United States (US)-India trade uncertainty to surging Oil prices and the significant outflow of Foreign Institutional Investment (FII) from the Indian stock market, every event brought nothing but pain for the Indian currency.
US Dollar mid-year outlook: Exceptional currency, exceptional risks?
The US Dollar enters the second half of 2026 in a markedly different position from a year ago. The King currency has recovered, reflecting persistent US inflation, changing expectations for Fed policy, geopolitical tensions and renewed demand for defensive assets.