The stock market bubble is about to burst – Several signs
Despite the tricky situation in the Middle East, America’s top stock indices are lingering near all-time highs. Even though most analysts predict a recession is near, investors, or better said speculators, seem to ignore this. Higher inflation readings should force central bankers to raise the interest rates, thus provoking a global recession. But let me show you the top signs that the stock market is overvalued and is set to burst.
Buffett indicator
The first and the foremost way of judging the stock market’s overvaluation is the Buffett indicator. As its name suggests, this measure was proposed by Warren Buffett, the investing legend, as a way to measure how much America’s stock market is worth relative to the country’s economy size, namely its GDP. You could calculate it by dividing the stock market’s total capitalization by the US GDP value.

A sound Buffett indicator value should historically be around 100% or below. Between 70 and 80% is generally considered to be a sound investment opportunity. At the same time, a figure close to or above 200% suggests substantial overvaluation and therefore a high risk.
Right now the Buffett indicator is clearly flashing red.
Right now the ratio is above 220%, a critical level historically preceding major downturns. Even during the dot.com bubble when there was a real high-tech stock frenzy, the indicator was around 150%, lower than it is now. This suggests a major risk. But it is not the only overvaluation sign.
The Shiller PE ratio
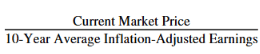
Another useful indicator is the Shiller PE ratio. It compares the S&P 500’s average stock price to the 10-year average inflation-adjusted earnings. It is calculated by using the following formula:
The diagram below presents Schiller’s ratio history over a period of 100 years.
Source: lynalden.com
Right now this ratio is close to 40, a figure seen during the dot-com mania in the early 2000s. The current Schiller’s ratio is even substantially above the one recorded during the “roaring twenties” when there was an irrational stock market frenzy preceding the Great Depression. The current situation obviously hints at the stock market’s overvaluation.
Record household exposure to equities
Household exposure to equities is calculated by taking equities’ market value and dividing it by US households’ net worth. This indicator measures laymen’s interest in stocks, which is at all-time highs right now. The diagram below shows that this indicator even beats the famous dot.com bubble era.
Source: Bloomberg
The fact that household allocations to stocks are near all-time highs suggests that we are close to the end of the bull market. This reminds me of the shoeshine boy anecdote. When Joseph Kennedy, the father of John Kennedy, was walking down the street in 1929, he decided to have his shoes cleaned by a shoeshine boy. The shoeshine boy started to give him tips on how to pick stocks. Joseph Kennedy went to the stock exchange to get rid of his stocks. This happened just before the dramatic sell off on the US stock market just before the Great Depression. The message of this anecdote is simple: it is highly dangerous to be invested in an asset class that is overpopular among investors with no special background. Something similar is actually happening now, it seems to me. This brings us to the next problem, namely speculators buying extremely expensive stocks of companies with weak fundamentals.
Hype
The most obvious example that we face nowadays is that of AI companies that are often invested in because of the future growth potential or better said hype. Many expect some of these companies to generate excellent earnings in the future. Some of these companies are not profitable at the moment though. But still, investors are willing to pay for their possible future now. Therefore, these companies’ valuations reach record levels. This is the last but not least sign that an asset bubble is about to burst but the key question remains “when?”.
Author

Anna Sokolidou
Independent Analyst
A research analyst, a freelance finance writer and an economics teacher looking for interesting investment opportunities. I have been investing for years. I am mostly interested in writing about commodities, precious metals and large corporations.

















