Tesla (TSLA): Why Elliott Wave supports higher prices toward $774

Tesla: Beyond Automotive Growth, Expanding into Technology and Infrastructure.
Tesla (NASDAQ: TSLA) remains one of the most closely followed companies in global markets. While many investors focus on electric vehicle deliveries and short-term earnings, Tesla’s long-term growth story extends far beyond the automotive sector. The company is expanding into artificial intelligence, autonomous driving, energy storage, robotics, and advanced manufacturing.
Over the last decade, Tesla has transformed into a global technology leader. It has built a scalable production network and established one of the strongest brands worldwide. Beyond vehicle sales, Tesla invests heavily in Full Self-Driving (FSD), Robotaxi services, Megapack energy storage, and the Optimus humanoid robot project. Each of these initiatives could become meaningful contributors to future revenue growth.
These projects give Tesla exposure to several large and rapidly expanding markets. The global shift toward electrification, rising energy storage demand, and advances in artificial intelligence represent secular trends that may support growth for years. As these segments mature, Tesla may increasingly be viewed as a technology and infrastructure company rather than solely an automaker.
Financially, Tesla maintains a strong balance sheet and substantial liquidity. This flexibility allows management to pursue long-term strategic objectives while remaining positioned to capitalize on future opportunities, even during periods of economic uncertainty.
Elliott Wave structure and technical outlook
From a technical perspective, Tesla’s price action continues to support the broader bullish thesis. Short-term corrections and volatility are normal within any major trend, but the larger Elliott Wave structure suggests Tesla completed a significant correction in January 2023. Since then, the stock has been building a new bullish cycle.
Tesla completed a five-wave advance within its Grand Super Cycle, culminating in the all-time high on November 1, 2021. From that peak, the stock entered a corrective decline that unfolded in a clear Elliott Wave structure. The correction reached the Blue Box buying area in January 2023, where support was found and the decline ended.
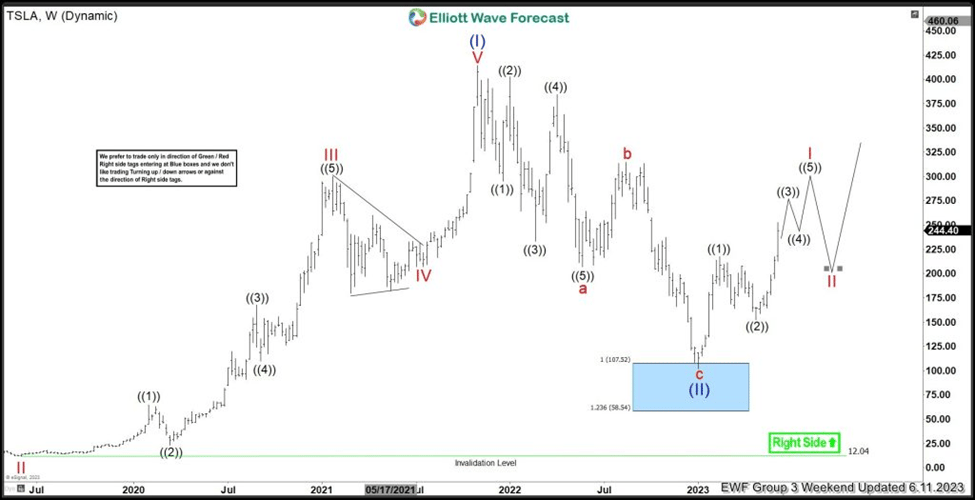
Since the January 2023 low, Tesla has produced higher highs and higher lows, confirming that the larger trend remains bullish. However, the advance has been overlapping. In Elliott Wave terms, this means the rally cannot be classified as a traditional impulsive Wave III. Instead, the structure suggests a bullish nesting sequence, with multiple (I)-(II) and I-II formations. These nesting structures often precede strong advances, as they represent the market building energy before a breakout.
Tesla weekly Elliott Wave chart
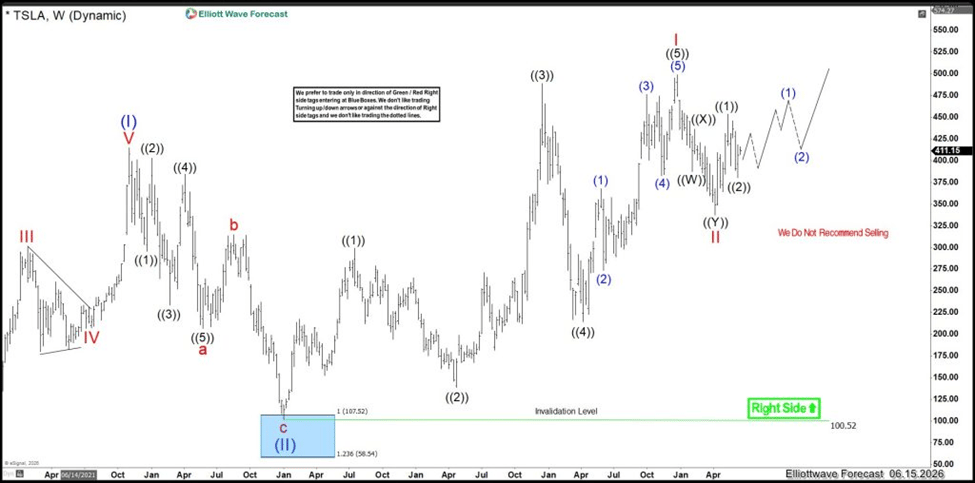
As a result, while many traders may be looking for opportunities to sell the stock after its substantial recovery, the Elliott Wave structure continues to favor the bullish side. As long as Tesla remains above the February 1, 2023 low, the larger cycle remains constructive and supports the view that the next significant move should unfold to the upside.
More recently, Tesla peaked in December 2025 and has been correcting that advance. The pullback has developed as a three-wave structure, which is another important signal. At Elliott Wave Forecast, we follow the principle that corrections unfold in sequences of 3, 7, or 11 swings. As long as the stock corrects in a three-wave manner, we prefer to align with the dominant trend.
Whether Tesla finds support against the April 9, 2026 low and resumes higher immediately, or extends lower toward the $293 area, weakness should be viewed as a buying opportunity. Any decline into the right support zone would be considered a gift for investors positioning with the trend before the next acceleration phase.
The current structure suggests Tesla may still be in the early stages of a much larger bullish sequence. As long as the January 2023 low remains intact, the path of least resistance favors higher prices. Our preferred Elliott Wave count supports a long-term target near $774, with potential for even higher levels as the broader cycle matures.
Author

Elliott Wave Forecast Team
ElliottWave-Forecast.com