Stocks to gain on better economic data – Is this an uptrend?

Stocks went closer to their recent local lows yesterday – is this still a potential bottoming pattern?
The S&P 500 index lost 1.16% on Thursday, as it got closer to the 3,800 level again. The broad stock market’s gauge continues to trade within an over two-week-long consolidation following mid-December sell-off from the 4,100 level. On previous week’s Thursday it reached new medium-term low of 3,764.49, before bouncing back above 3,800. Overall it kept extending a consolidation recently. In mid-December the S&P 500 has been negatively reacting to the December 14 FOMC interest rate hike, among other factors.
The S&P 500 will likely open 0.4% higher this morning following better-than-expected Nonfarm Payrolls release (+223,000 vs. the expected +200,000). Also, the Unemployment Rate fell to 3.5% and the Average Hourly Earnings gained just 0.3% m/m. The S&P 500 index trades within a consolidation along the 3,800 level, as we can see on the daily chart:
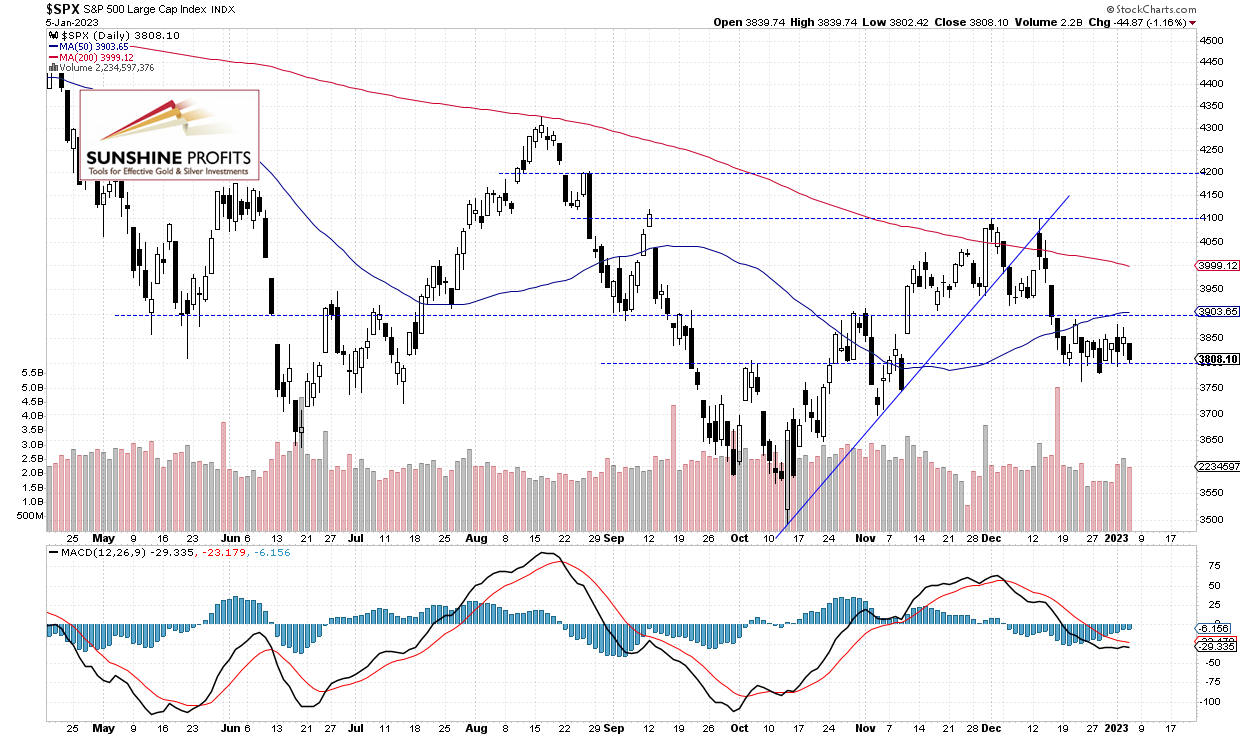
Futures contract remains above 3,800
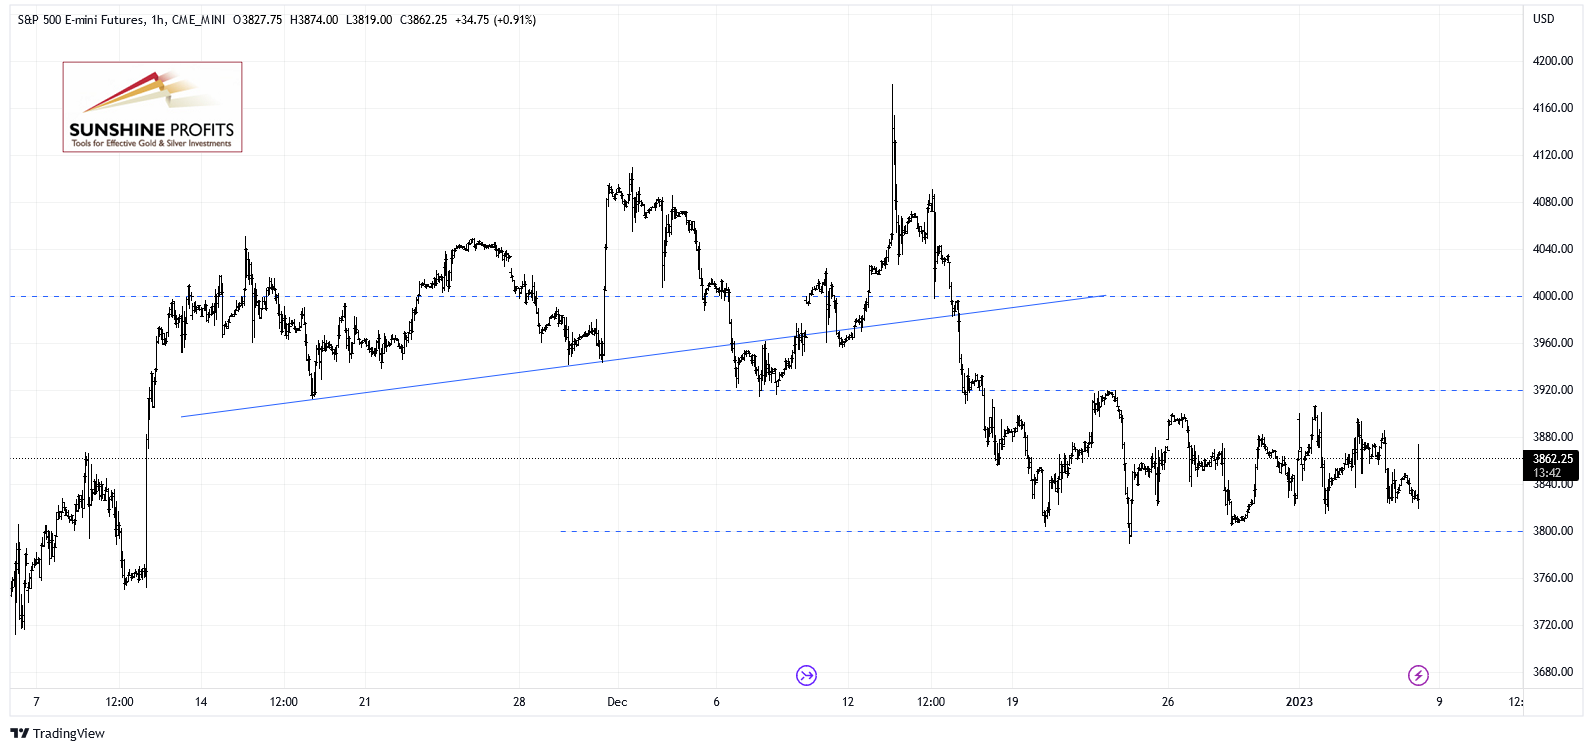
Let’s take a look at the hourly chart of the S&P 500 futures contract. It went higher following the important monthly jobs data release. The resistance level is at around 3,900-3,920, and the support level remains at 3,800.
Conclusion
Stocks will likely open higher this morning. So it may see more sideways trading action. Investors will be waiting for the next week’s Fed Chief Powell’s speech on Tuesday, the Consumer Price Index release on Thursday and a coming quarterly corporate earnings season. There have been no confirmed positive signals so far. However, stocks may be forming a bottom here.
Here’s the breakdown:
-
The S&P 500 index is expected to open higher this morning on monthly jobs data.
-
There have been no confirmed positive signals so far, however, stocks may be forming a bottom.
-
In my opinion, the short-term outlook is bullish.
Want free follow-ups to the above article and details not available to 99%+ investors? Sign up to our free newsletter today!
Want free follow-ups to the above article and details not available to 99%+ investors? Sign up to our free newsletter today!
Author

Paul Rejczak
Gold Price Forecast
Paul Rejczak is a stock market strategist who has been known for the quality of his technical and fundamental analysis since the late nineties.

















