Stock markets ready to recover?

Emini S&P futures
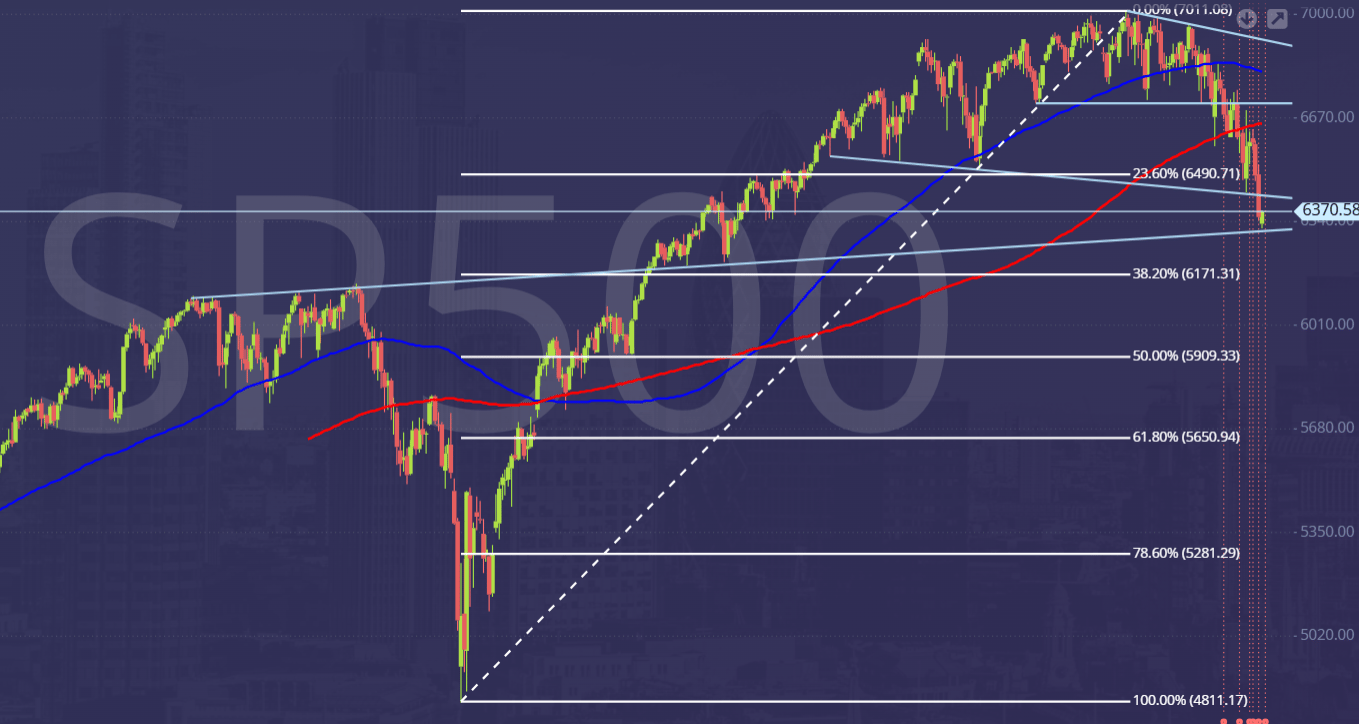
Emini S&P June futures reversed from 6568, not reaching the 6580/90 area.
The break of support at 6545/6525 hit my downside target of strong support at 6420/6400 & made a low for the day only 10 points lower.
A potential profit of up to 1000 ticks if you caught the trade.
Longs need stops below 6380 on Monday morning & a break lower can target 6350/45.
Friday's close at the low of the week certainly is negative for the start of this week - so we need some more positive news out of the middle east to trigger a recovery.
There's support at 6425/6415 but a break below 6400 should be a sell signal targeting 6370/6360.
Below here look for 6335/6330 but we could free fall as far as strong support at the 6250/6200 area.
Longs at strong support at 6420/6400 can target 6435 & 6455, perhaps as far as resistance at 6480/6500.
Bulls need a break above 6520 for a buy signal targeting 6560/6570.
Nasdaq futures
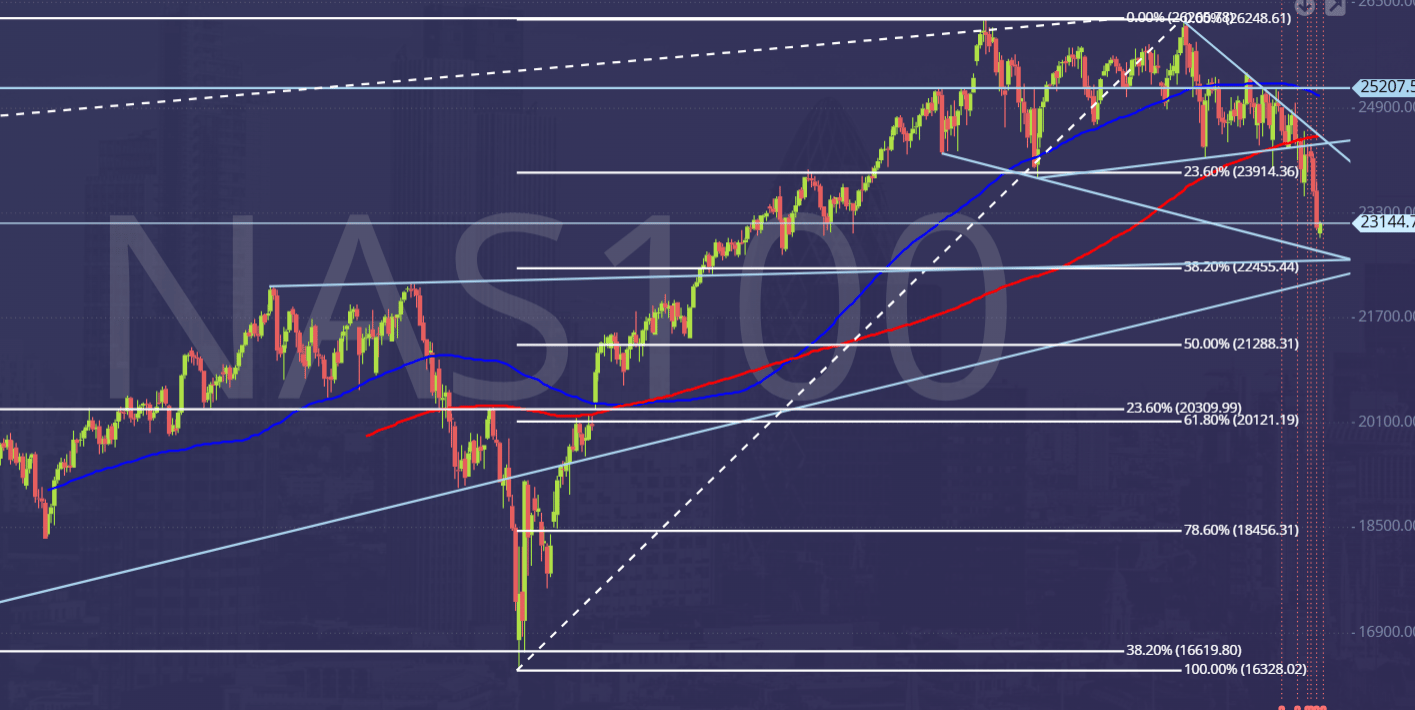
Emini Nasdaq June futures held below minor resistance at 24100/200 to test strong support at 23550/23440 but we continued lower through 23350 for a sell signal.
I do have a descending trend line going back to 10 October at around 23200/23150 and an important weekly moving average at 23000.
So strong support at 23200/23000 is key to direction.
If we can recover & hold above 23440, that would also be positive. Then above 23700 looks more positive.
A break below 22900 however would therefore be a sell signal.
One major concern is the double top pattern from the peaks in late October & late January....the neckline is at 23904 & we broke that on Friday.
In theory, in the longer term we could fall as far as 22000/21500 - which is coincidentally where we meet the 100 day moving average - so it should be an excellent buying opportunity.
A break below 22900 on Monday can target 22650/600...probably quite quickly.
And then we have that target & buying opportunity at 22000/21500.
Emini Dow Jones futures
Emini Dow Jones June sold off again to targets of 46200/46050, 45850 & 45453.
We fell as far as 45272- with strong support at 45300/45100.
This is key to direction so a break below 44950 should be a sell signal & can target 44400/44300 for profit taking on shorts.
A break below 23,860 signals further losses towards 23,740/720 then 23,600/23,550.
Author

Jason Sen
DayTradeIdeas.co.uk
Jason Sen began his career in the options pits on the trading floor of LIFFE in 1987 at the age of 19, making markets on his own account. In 2001 when the trading floor closed he successfully made the transition to day trading on computer screens.