|

SPY ETF: Wave ii pullback finds more buyers in blue box

Hello Traders, in this article we will analyze our forecast for SPY ETF in the short term cycle. Since the short term peak of SPY from 05.30.2023 to end wave i of (iii) we have been expecting a pullback within wave ii to take place. Thereafter, we were expecting more upside within wave iii. Here at Elliott Wave Forecast we have in place a system that allows us to measure an area in which we can expect a react to take place.

We call it equal legs area or blue box area as you might have seen within our charts. These areas provide us with at least an 85% chance of a minimum of 3 waves bounce or reaction to take place. We can use these areas to enter in the market with a defined entry, Stop Loss and exit strategy. So once we had in place a and b of ii we were able to present for members the blue box buying area in which we expected to end c of ii.

We teach how to use our system within our member’s area and live trading room. Once a member or in trial you will be able to gather more of that information under your disposal. Nevertheless, let’s have a look now at the 30 min chart of SPY as provided to members from 05.31.2023. We have been expecting more downside to reach the blue box area before turning higher.

SPY 30 min chart Pre Market Update 05.31.2023
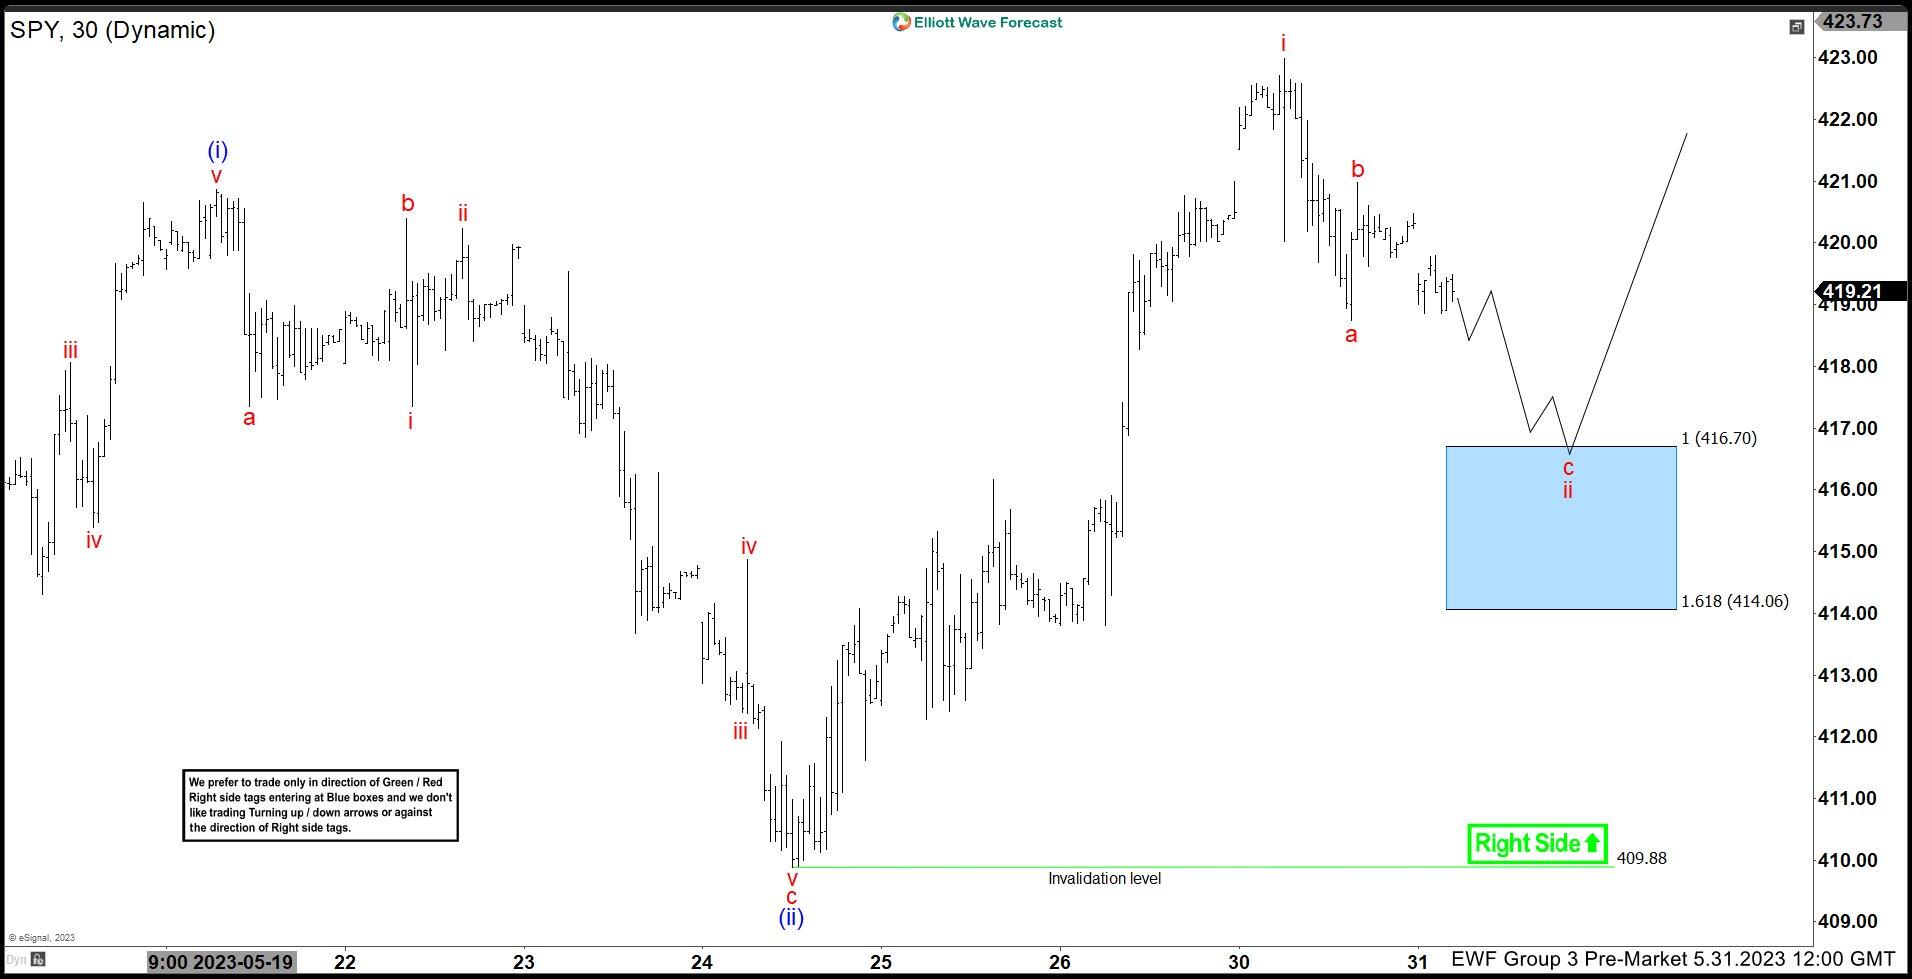
As we can see the market was expected lower within c of ii to reach the blue box area. We recommend members to always buy from the 100% extension area with a stop loss just below the 1.618 area. Fast forward, towards the latest post market update now from 06.06.2023, we will see that the market has already reacted higher and what we expect next.

SPY 45 min chart Post Market Update 06.06.2023
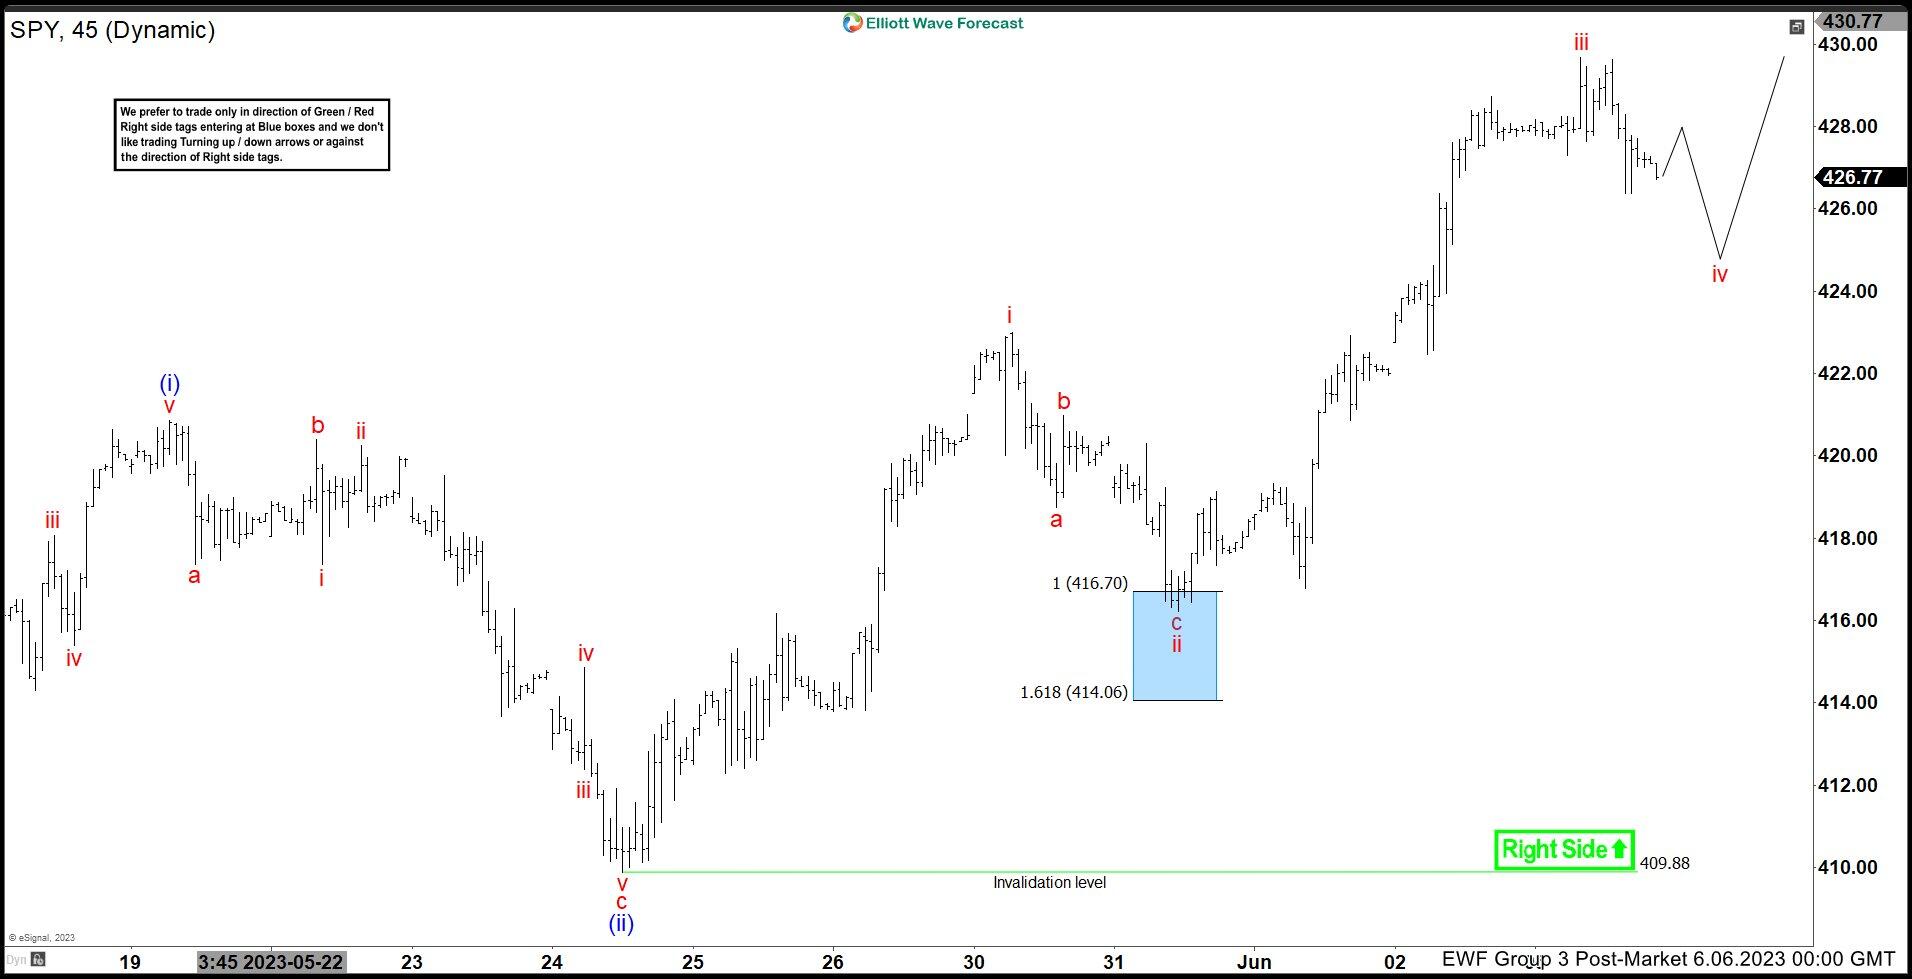
A strong reaction higher took place from the blue box area. The reaction higher within wave iii of (iii). And then expecting the pullback within iv before one more high in v to end (iii).

Author

Elliott Wave Forecast Team

Elliott Wave Forecast Team

ElliottWave-Forecast.com

More from Elliott Wave Forecast Team
Share:

Editor's Picks

AUD/USD keeps the red near 0.6950 after weak Aussie jobs data

AUD/USD holds losses near 0.6950 on disappointing Australian jobs data, extending the previous day's retracement slide from the monthly high and hitting a fresh weekly low during Thursday’s Asian session. Meanwhile, declining US bond yields drag the US Dollar away from the April 2025 high, touched after Wednesday's hot US CPI, helping limit losses for the currency pair.

USD/JPY slides back below 158.00 as USD reverses post-CPI gains

USD/JPY extends the previous day's pullback from a three-week high, attracting follow-through selling and sliding below 158.00 during Thursday's Asian session. Traders remain on high alert amid speculation that authorities will step in to prop up the Japanese Yen. The US Dollar, meanwhile, reverses Wednesday's hot CPI-led gains to April 2025 highs as US bond yields retreat on China bond-buying talk, further pressuring the pair.

Gold: Upside remains capped by $4,200

Gold regains the smile and leaves behind three consecutive days of losses, advancing to the $4,170 region per troy ounce on Thursday. The precious metal’s recovery comes amid the fresh offered stance in the Greenback and declining US Treasury yields while investors remain cautious ahead of the Fed’s Warsh speech on Friday.

Ripple clings to $1.30 support as downside risks intensify

Ripple is stuck in a bearish trend, trading near $1.30 on Thursday. The remittance token’s bearish shift reflects the broader cryptocurrency market, which remains under heavy selling amid concerns about accelerating inflation in the US.

Budget preview: Is Healey impressing the bond market?

There is less than 2 weeks to go before the Chancellor delivers his first budget. Unusually for the UK, the economic and financial backdrop to this budget is upbeat. UK bonds have been rallying, the FTSE 100 is the top performing major stock index this week, and the Pound is also stabilising versus the Dollar.

Everyone's dumping Gold after hot US inflation. Here's why $4,100 could be a floor, not a cliff
Gold (XAU/USD) is recovering from a sharp sell-off triggered by hotter-than-expected United States (US) inflation data released on Wednesday. The precious metal briefly plunged toward $4,073 as investors increased their bets on further Federal Reserve (Fed) interest rate hikes before recovering as US Treasury yields and the US Dollar (USD) reversed their initial gains.
















