SPX Elliott Wave: Mapping the path ahead

In this technical blog, we’re going to take a quick look at the Elliott Wave charts of the SPX Index published in the members area of our website. Recently, SPX formed an intraday 3-wave pullback following a rally, which fits a typical Elliott Wave bullish sequence. Price completed a clear 3-wave move down from the peak and found support at the Equal Legs zone, our potential buying area.In the following analysis, we explain how we navigated the setup with our members and discuss our call on the SPX price action.
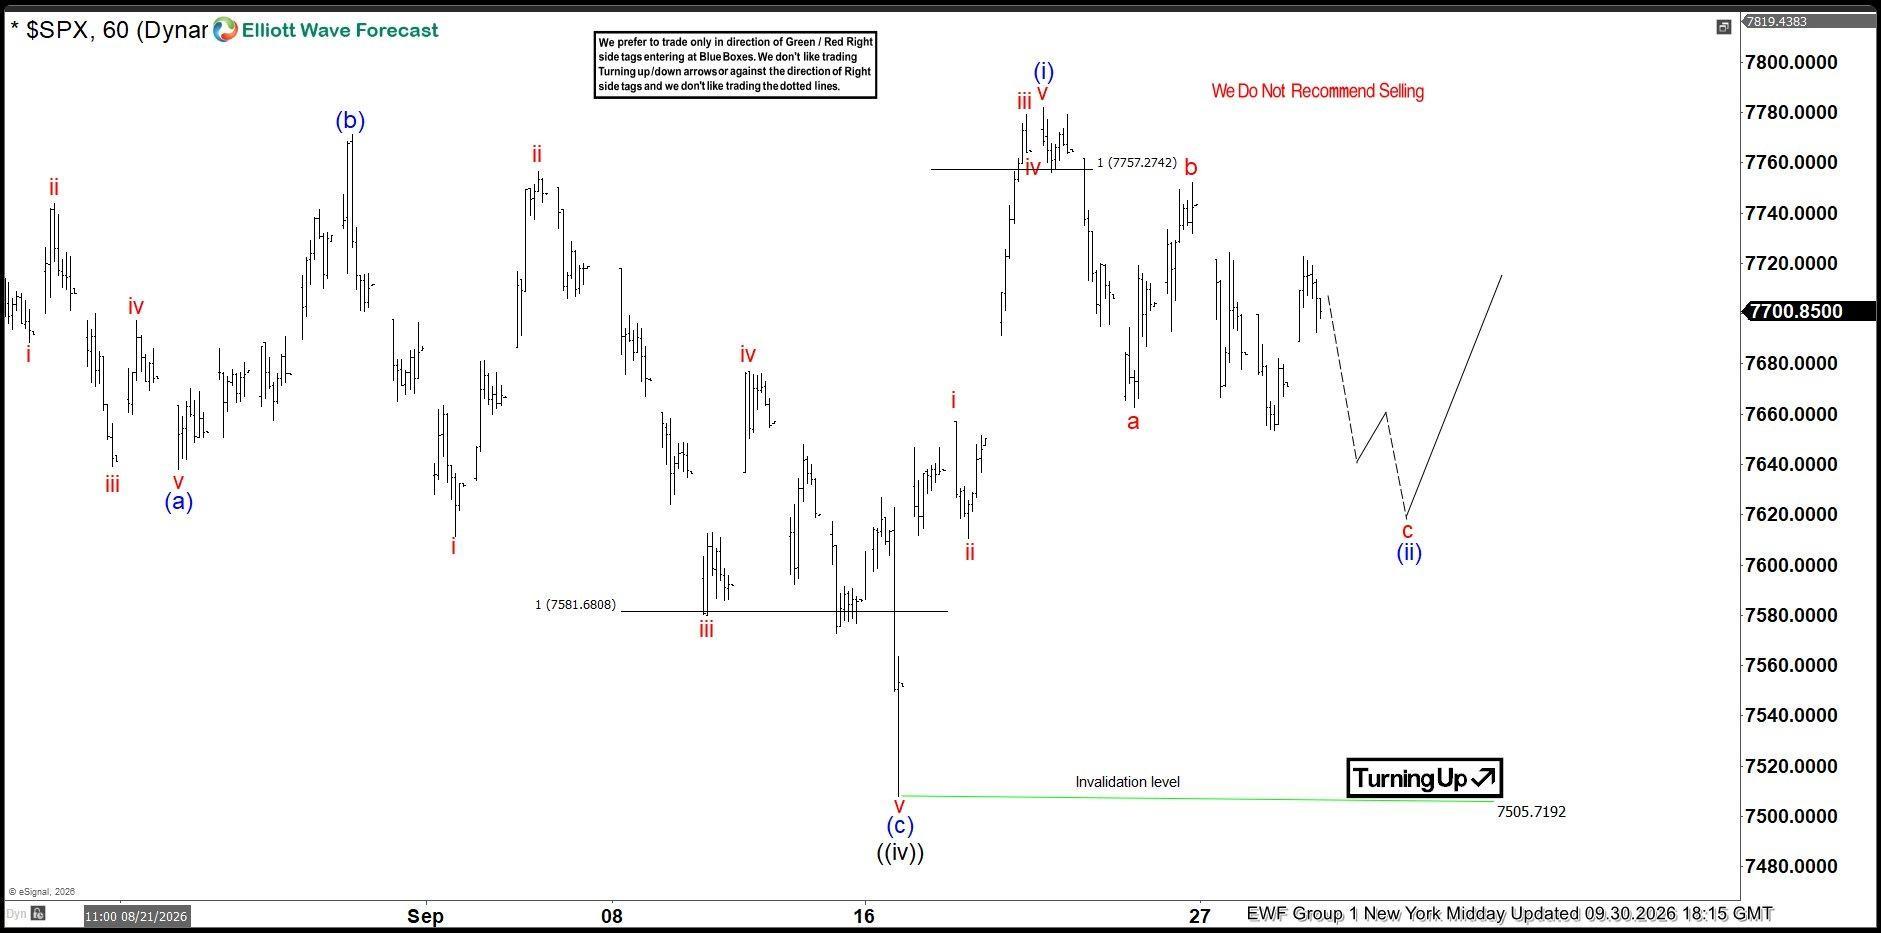
SPX Elliott Wave one-hour chart 09.30.2026
SPX is forming a three-wave pullback from the recent highs. The structure currently appears incomplete, suggesting that SPX could see further downside before the correction is completed.
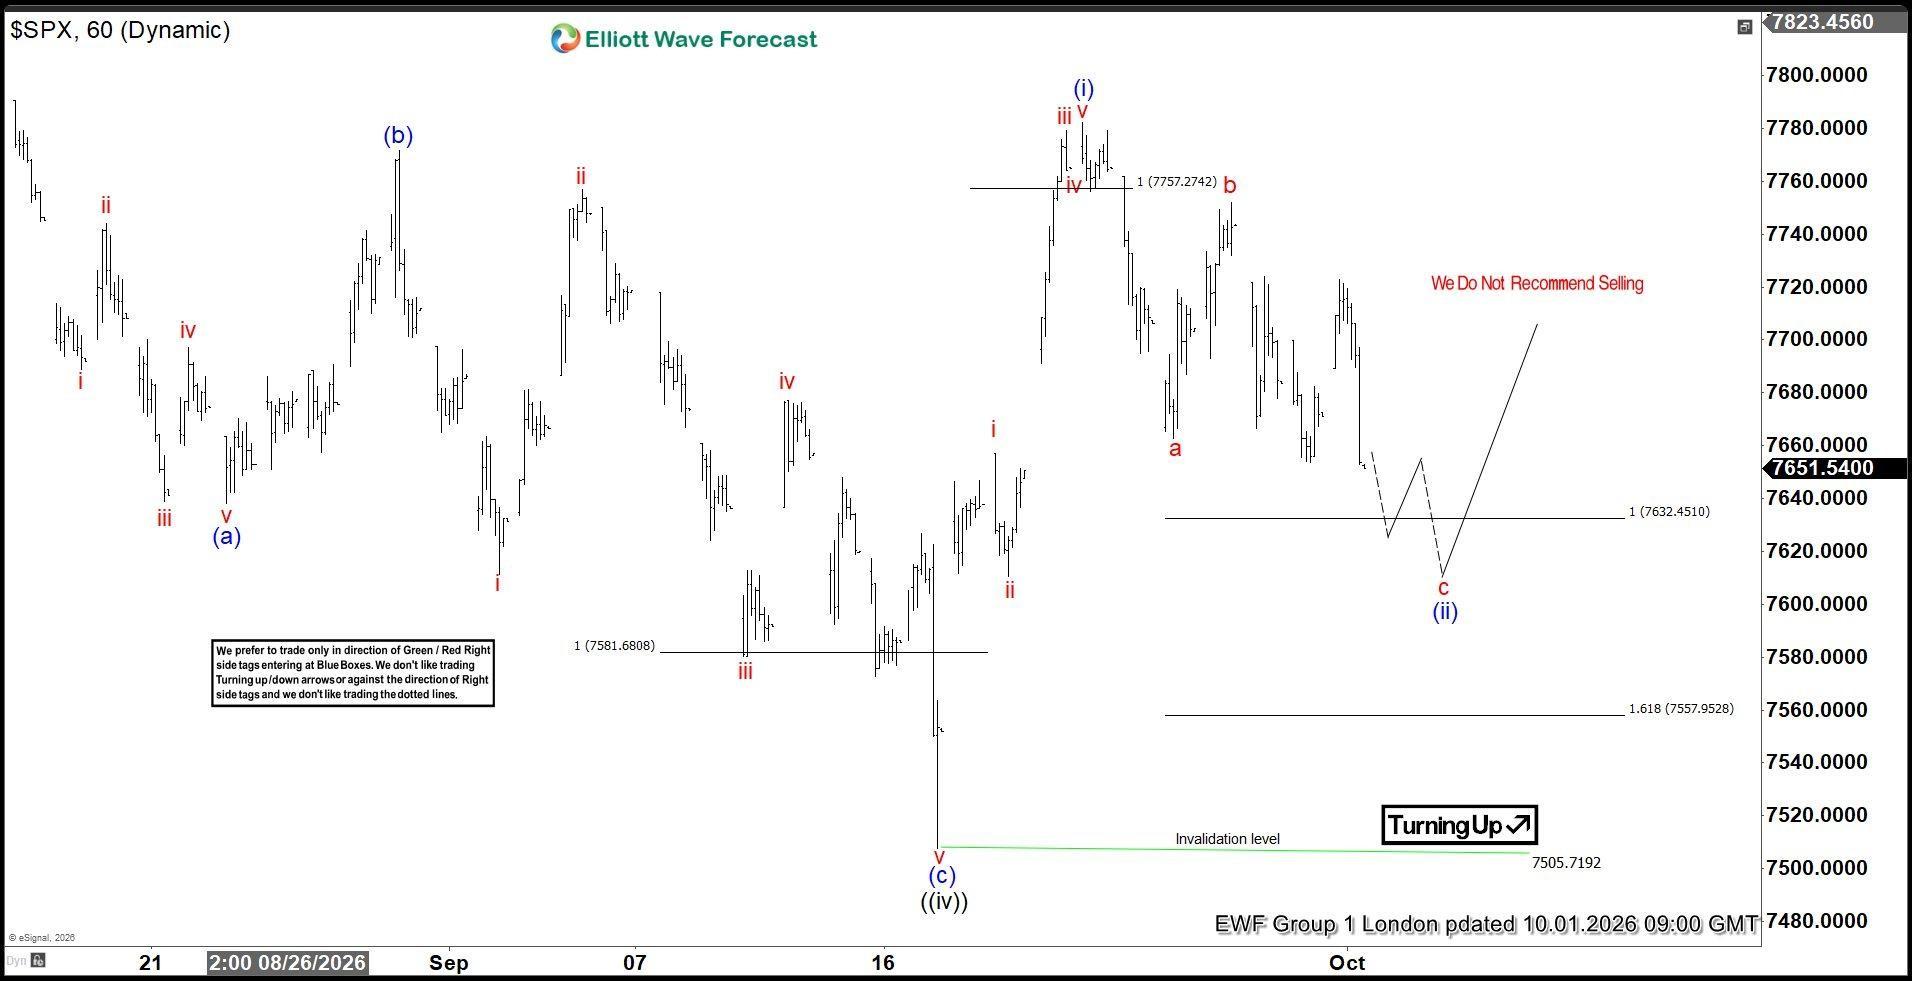
SPX Elliott Wave one-hour chart 10.01.2026
SPX continued declining as expected, confirming the proposed scenario. As our members know, the target, or buyers’ zone, is identified by measuring the Equal Legs area using the Fibonacci Extension tool, comparing the red wave a to the red wave b. The ideal support area comes in at 7362.45–7557.95. From this zone, we expect buyers to step in and take control, pushing the price higher in at least a three-wave bounce, with the potential to extend toward new highs.
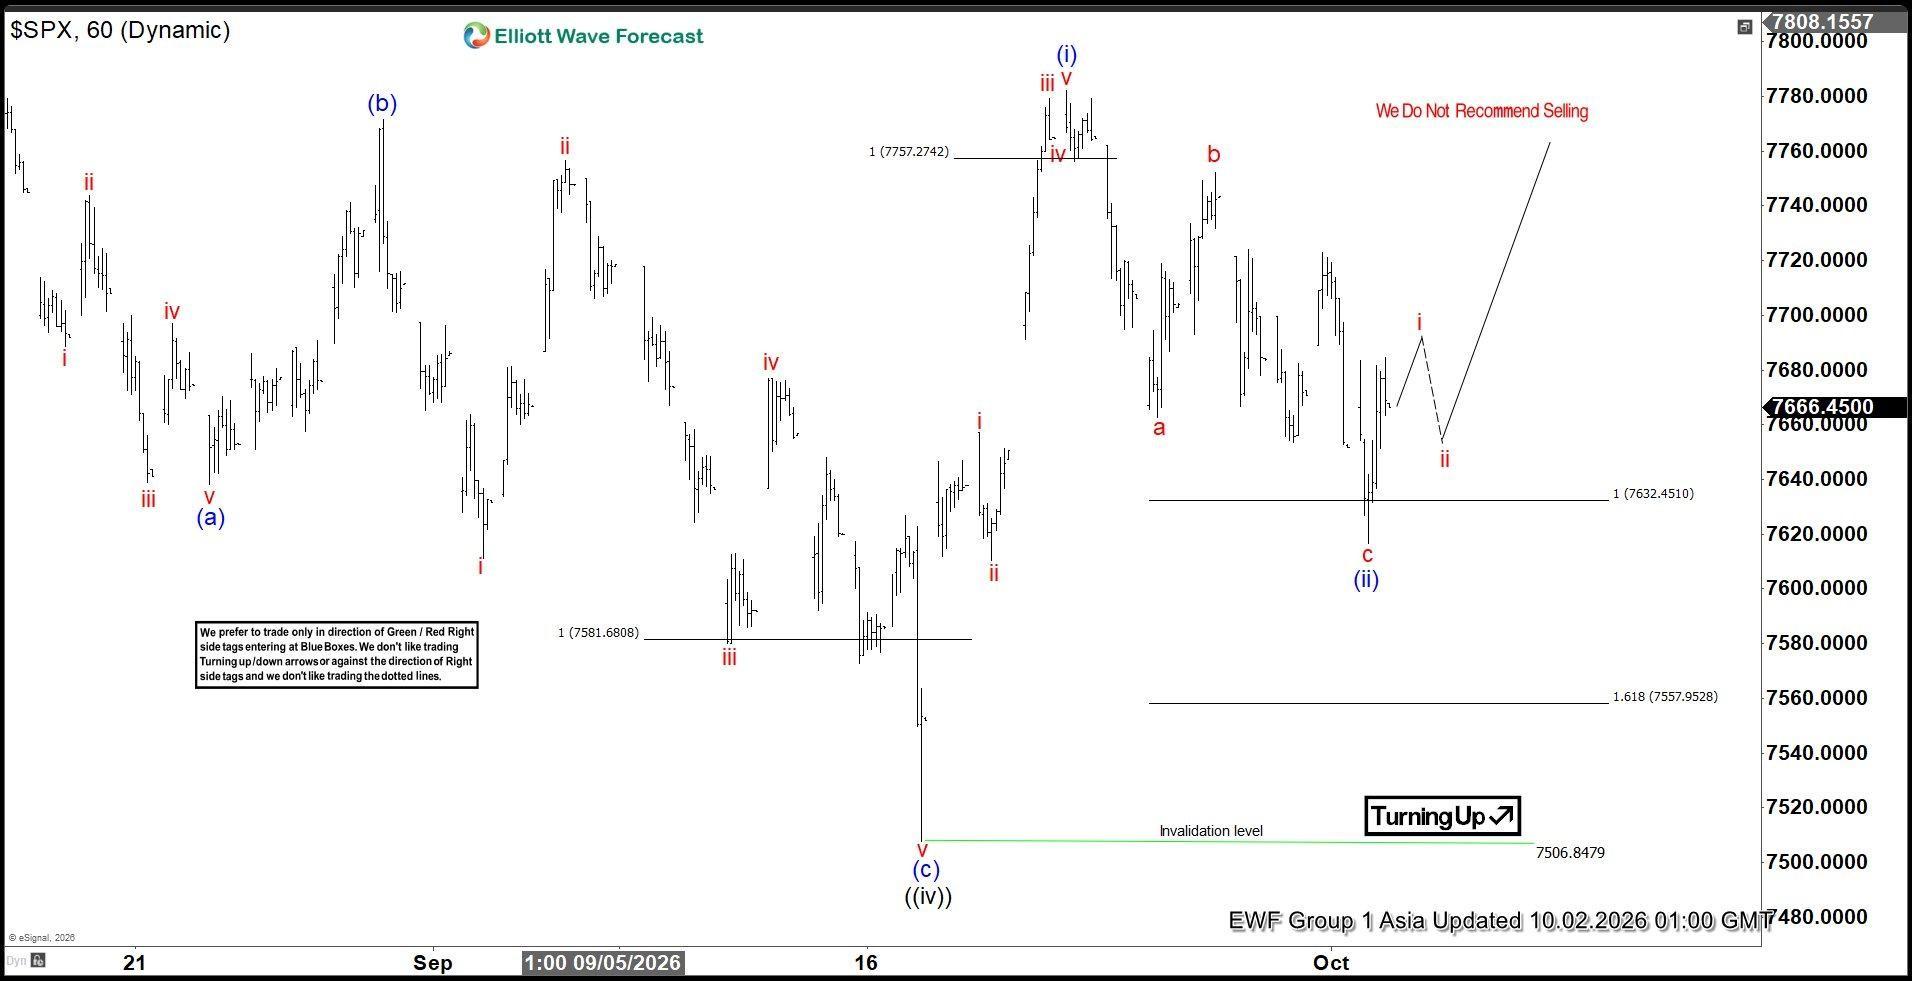
SPX Elliott Wave one-hour chart10.02.2026
SPX declined as expected and found buyers right at the Equal Legs zone, producing a reaction from that area. The pullback (ii) is now considered completed at 7616.9. As a result, any long positions taken from the Equal Legs zone are now risk-free after moving the stop to breakeven. We expect SPX to continue trading higher. The key level at this stage is 7616.9. As long as the index holds above this low, further upside should ideally be seen according to our primary view.
Author

Elliott Wave Forecast Team
ElliottWave-Forecast.com
















