SP500 forecast: Oversold breadth signals pullback exhaustion, fresh record highs ahead?

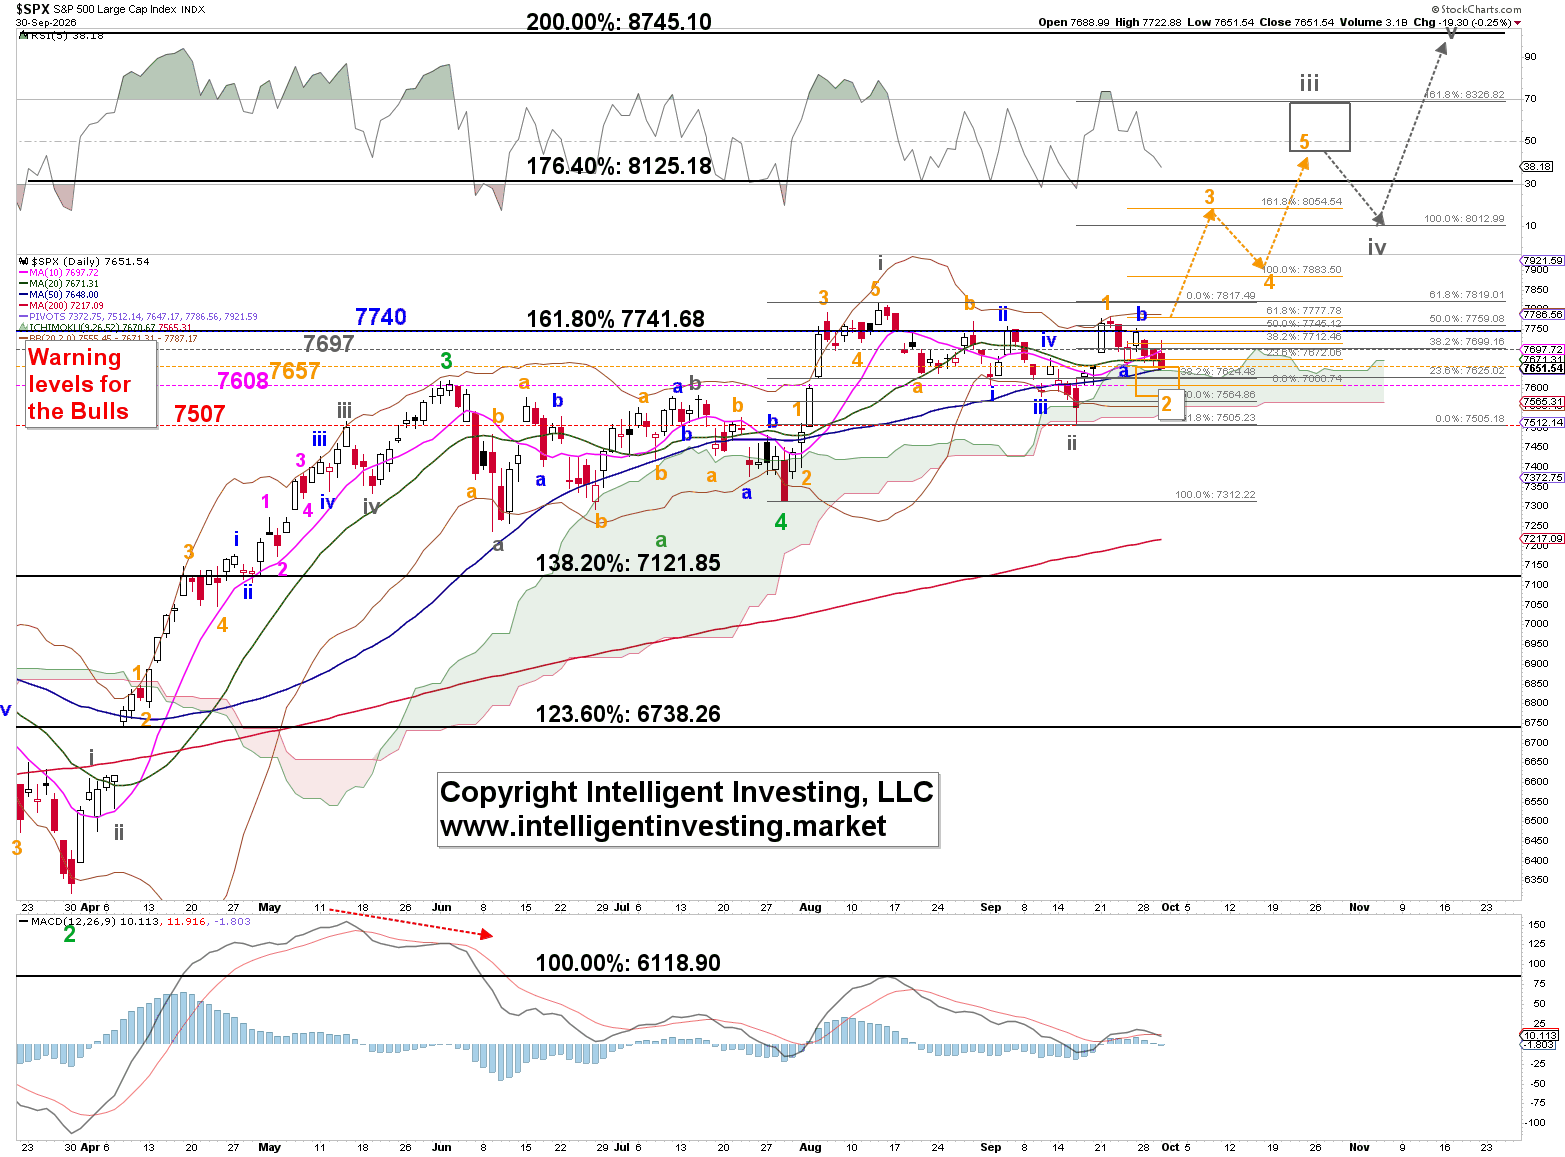
Price action since the August all-time high (ATH) has been largely sideways and has left much to be desired. The index bottomed on September 16, right at the 62% retracement of the July-August rally, which is common for a 2nd wave: gray W-ii. It then rallied for another three days, which we can count internally as five smaller waves up: orange W-1. Hence, a short-term pullback, orange W-2, should now be underway, ideally targeting 7610 +/- 30. See Figure 1 below. From there, we can expect a larger rally to 8700+.
Figure 1: S&P 500 daily chart with our bullish Elliott wave count and several technical indicators.
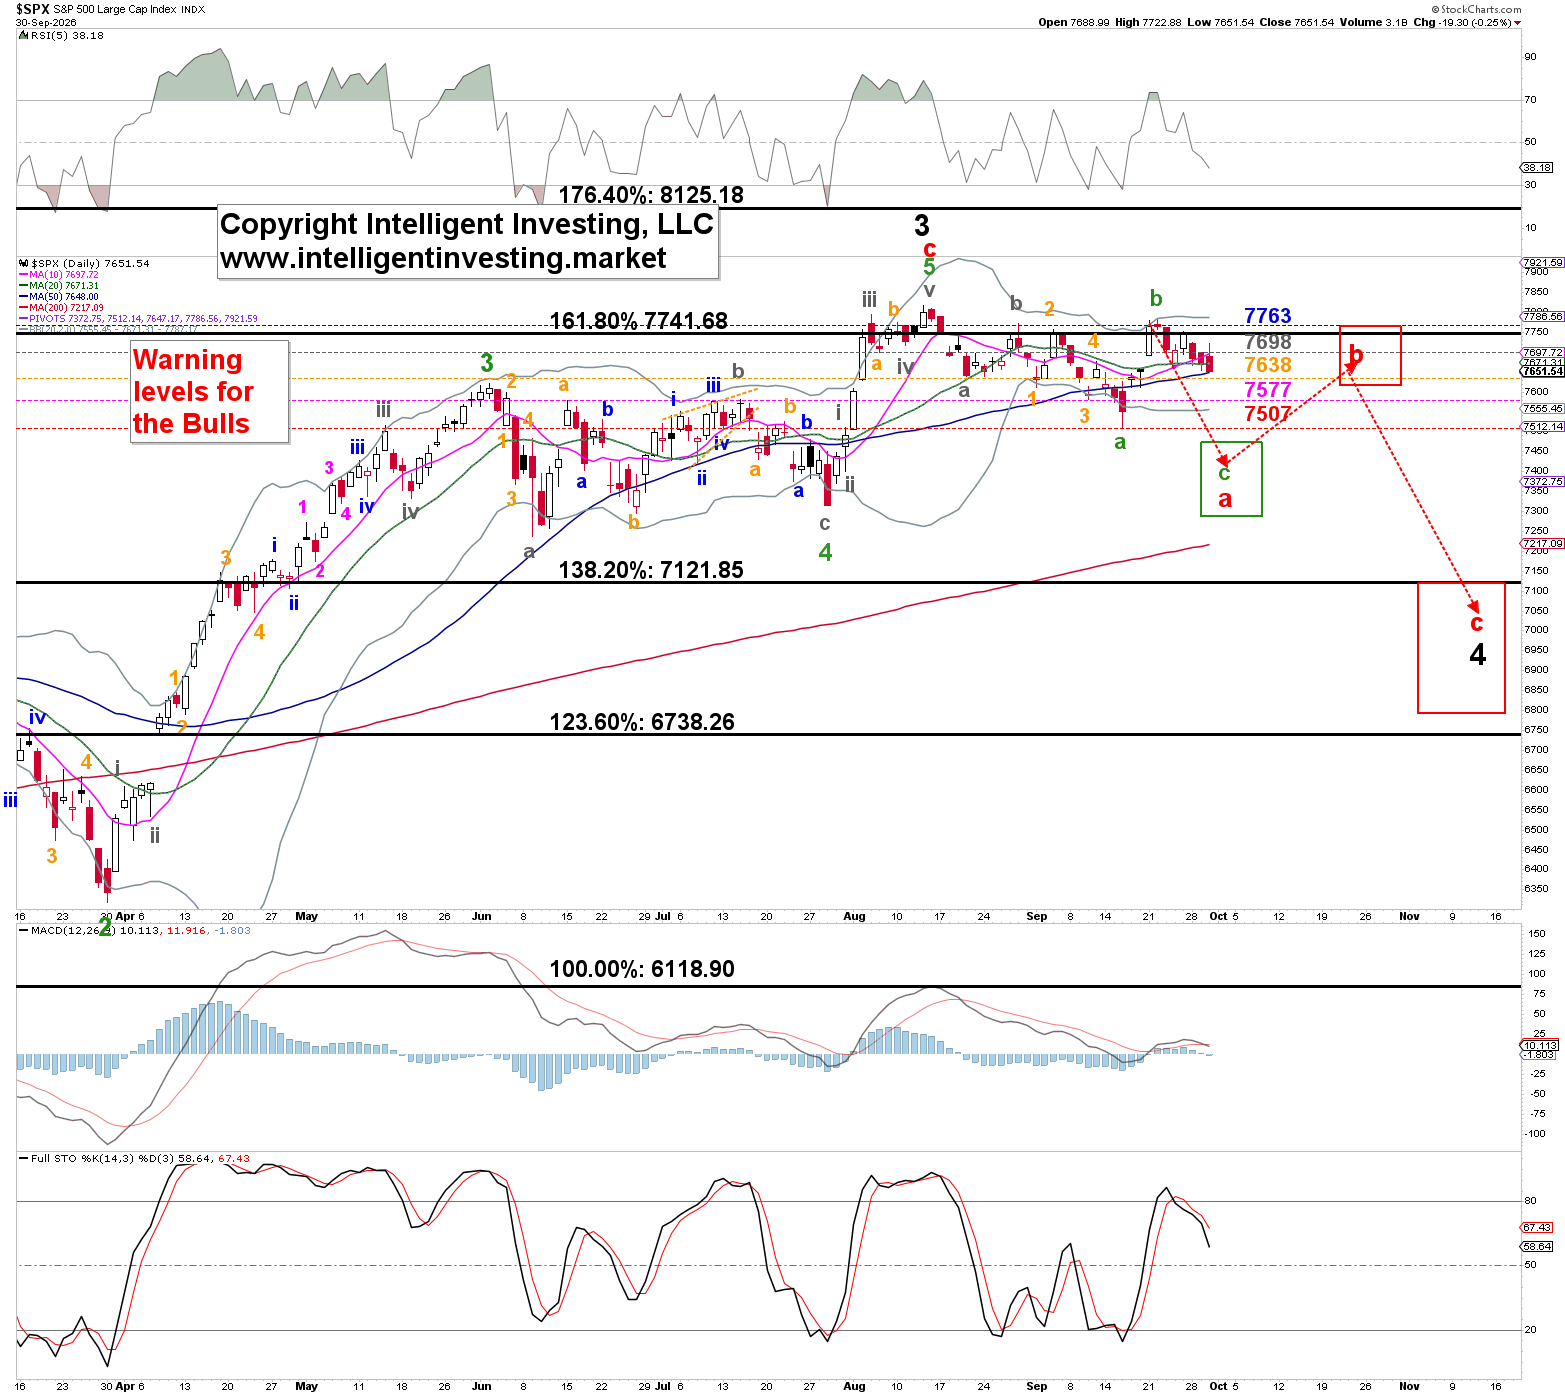
However, the index must remain above the September 16 low of 7507 for this pattern to unfold. If it can’t, we must turn course and assign a bearish wave count. See Figure 2 below. In that case, the September 16 low was green W-a. Last week’s top was green W-b, and green W-c to 7350 +/- 100 is now underway.
Figure 2: S&P500 daily chart with our bearish Elliott wave count and several technical indicators.
A factor supporting a higher move soon is that market breadth is becoming extremely oversold. The McClellan Oscillator (SPX-MO, a measure of how many stocks are advancing and declining) has been negative since mid-August, contributing to the current decline. Because it’s been negative for so long, its related Summation Index (SPX-SI) is now extremely oversold. See Figure 3 below.
Figure 3: SPX-MO (insert) and SPX-SI daily charts.
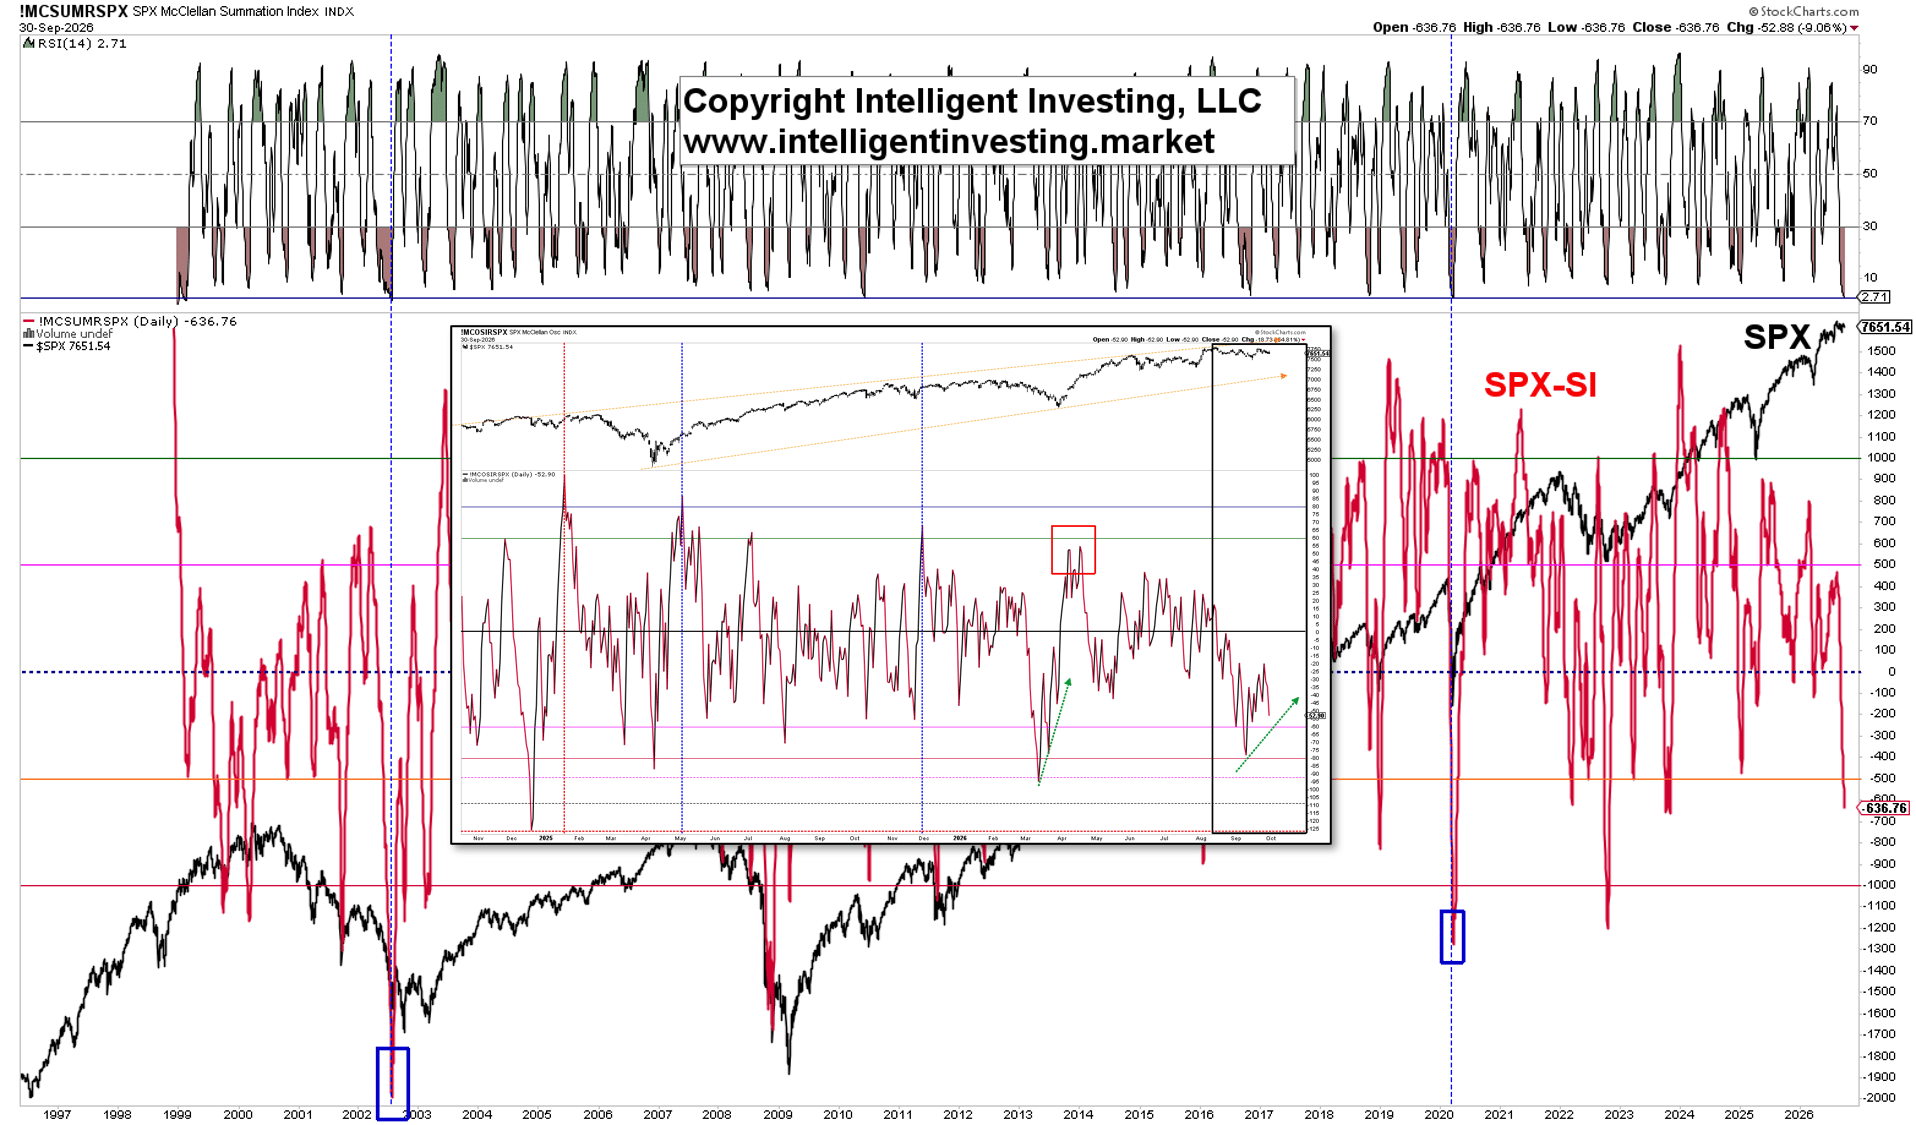
Specifically, the SPXSI’s daily RSI5 stood at just 2.71 yesterday, while the indicator itself was at -636. These levels are rarely seen and mark bottoms, not tops. The former has occurred only twice in its ~28-year history:
· In 2002, the RSI5 dropped below 2.71 on July 18. The index was at 881. It fell to 797 by July 23, rallied to 962 by August 22 (9.5% risk vs 9.2% reward), and then completed its bear market two months later.
· And during the COVID-19 crash. The RSI5 dropped to 2.74 on March 20 as the index was at 2304. It fell to 2237 by March 23, which was the low.
Overall, these two occasions don't align because they occurred at the end of severe bear markets, whereas the current market is only ~2.1% below its ATH from a month and a half ago. Hence, current conditions are unprecedented. We excluded the 1999s, which also recorded RSI5 readings below 2.7 because the indicator was likely still establishing itself. If we included the ‘99s, the verdict would be very bullish.
Corrections can occur in price or time as the market sheds excess and overbought conditions before it can move higher again. But they can also happen internally. In this case, it appears the market is doing the latter. While many stocks are down significantly over the last month and a half, the major indexes are holding up surprisingly well. Meanwhile, given that the SPXSI has little room left for further downside and sits at levels akin to those seen in deep corrections and bear markets, we must watch vigilantly for a strong reversal.
Author

Dr. Arnout Ter Schure
Intelligent Investing, LLC
After having worked for over ten years within the field of energy and the environment, Dr.
















