|

S&P 500 technical setup: Rising trendline remains the key line in the sand

The S&P 500 is holding an important short-term technical inflection point as traders continue to watch the rising trendline that has contained every pullback since the June 9 low. The line connects the June 11 and 26 lows with the July 23 and 27 lows, making it the clearest near-term reference point for whether the recent advance can remain intact. See the red circle in Figure 1 below.

Figure 1. Short-term Elliott Wave count with technical indicators for the SP500
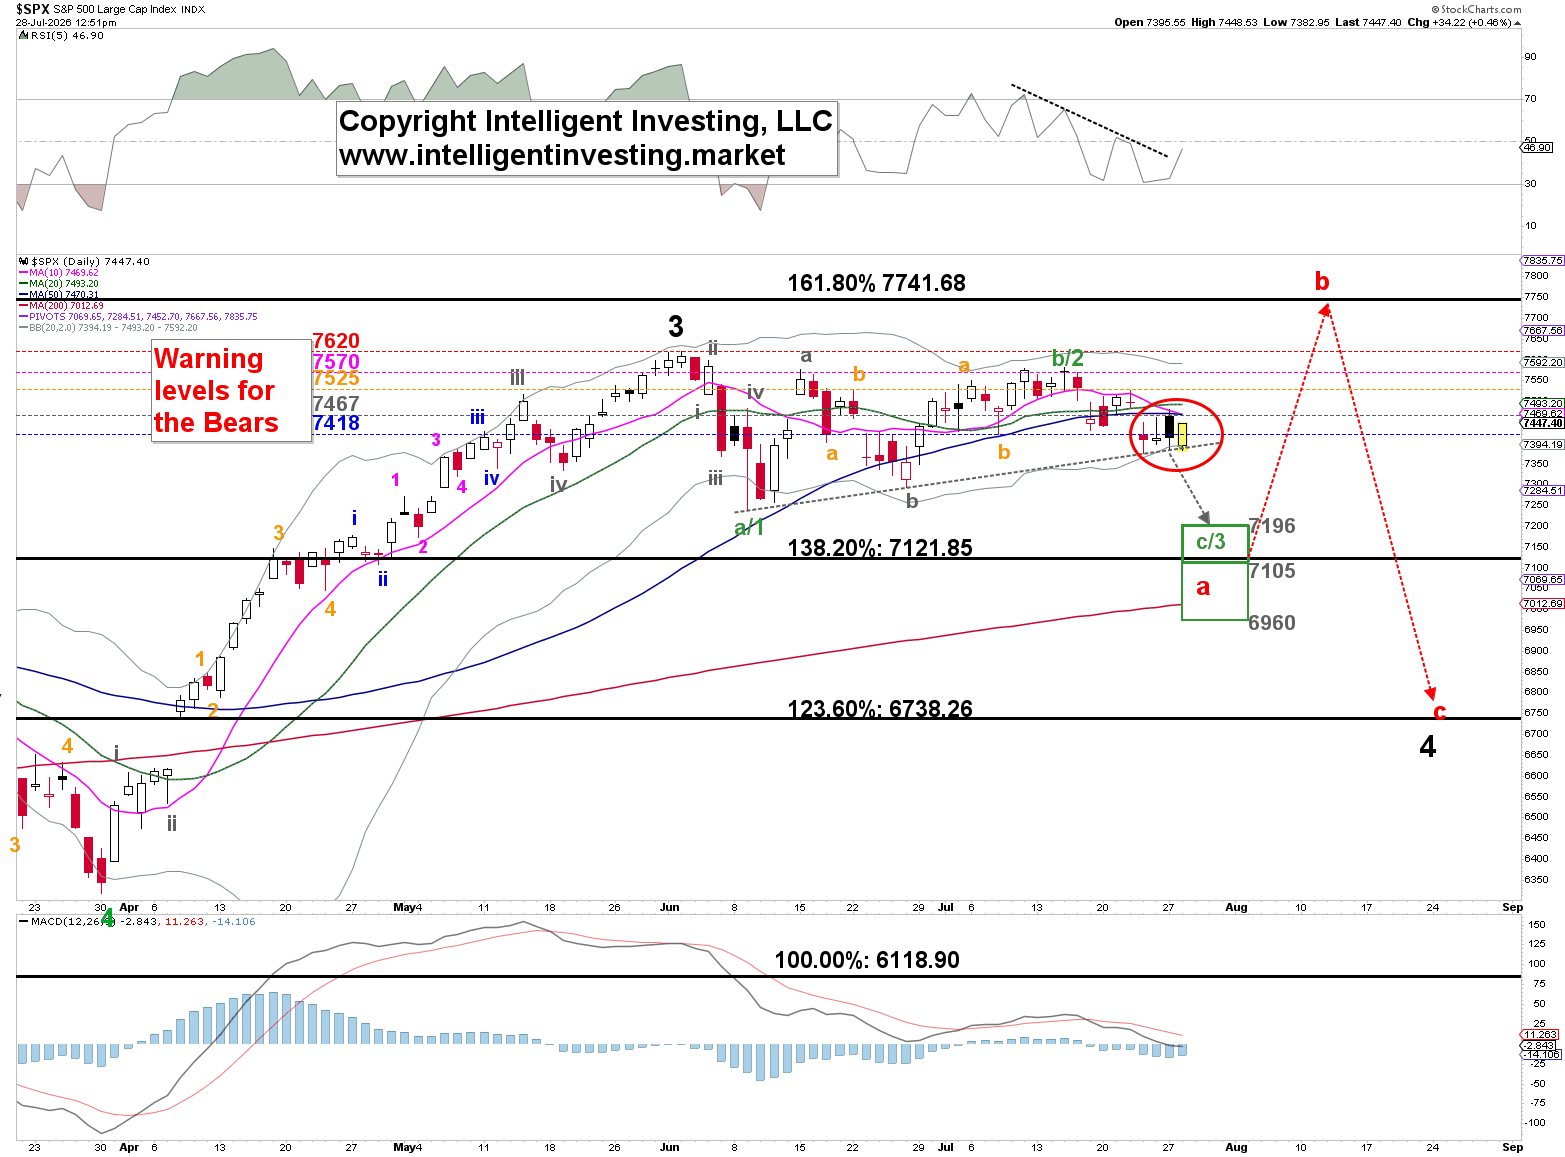
For now, the setup is straightforward: a decisive break below the trendline would shift the tone. In that scenario, a deeper retracement into the 6,960–7,200 support zone would become possible, with 7,105 standing out as the ideal downside magnet. Such a move would signal that the sequence of higher pullback lows has finally broken, weakening the short-term bullish structure.

However, if the index holds above that rising support line, as it is today, bulls retain the opportunity to stabilize price action and attempt another push toward the 7,580 area on a break above the (blue) 50-day Simple Moving Average (now at 7,470), possibly as high as 7,740. That zone remains the next upside objective if buyers can defend the trend and regain momentum. See the red circle in Figure 2 below.

Figure 2. Short-term Elliott Wave count with technical indicators for the SP500
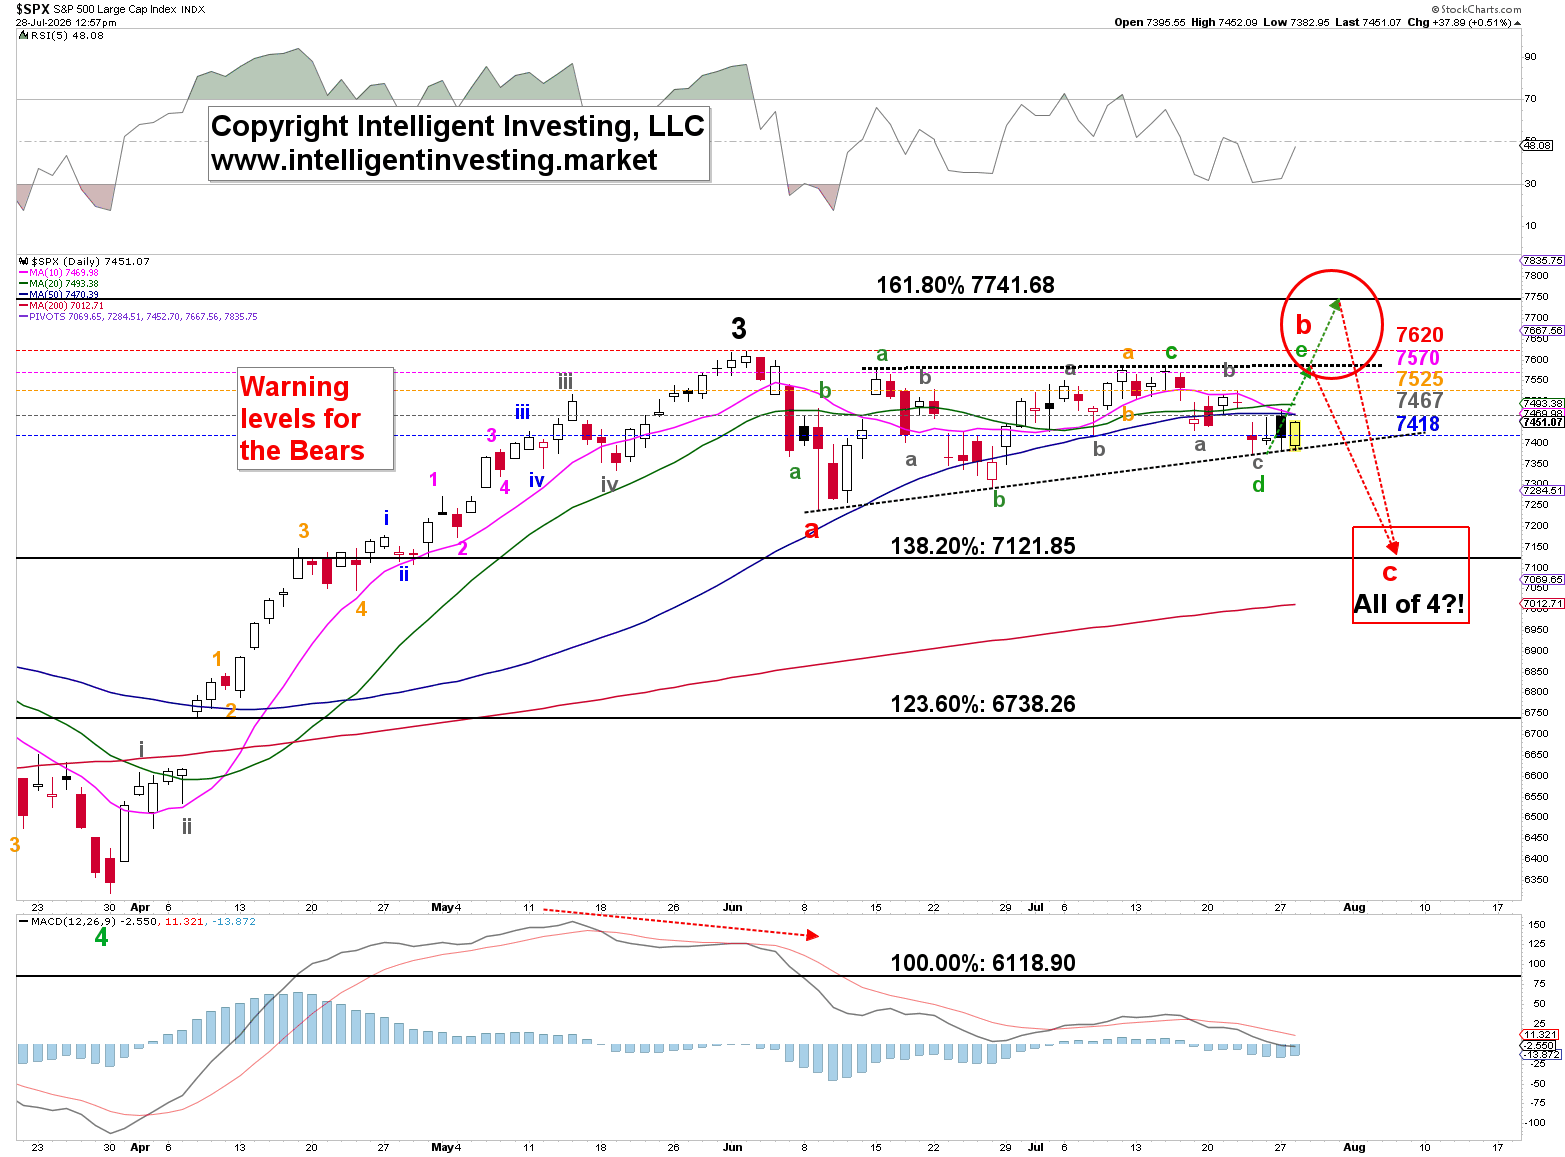
The current S&P 500 technical snapshot also points to a cautious backdrop, with the index trading below its 50-d SMA and daily technical signals leaning bearish. That makes the trendline test especially important: a hold could allow dip buyers to reassert control, while a break would likely invite additional selling pressure. As such, the roadmap is straightforward. Hold the rising trendline, and bulls get another shot at 7,580-7,740. Lose it, and the focus shifts quickly to 7,105 within the broader 6,960–7,200 support zone.

Author

Dr. Arnout Ter Schure

Dr. Arnout Ter Schure

Intelligent Investing, LLC

After having worked for over ten years within the field of energy and the environment, Dr.

More from Dr. Arnout Ter Schure
Share:

Editor's Picks

GBP/USD remains slightly bid near 1.3300

GBP/USD now advances marginally and manages to dispute the 1.3300 region on Tuesday. Indeed, Cable regains some balance on the back of the lacklustre performance of the Greenback, all preceding the Fed’s meeting on Wednesday and the BoE’s gathering on Thursday.

EUR/USD recedes from tops, back below 1.1400

EUR/USD manages to set aside part of the recent weakness and clinches decent gains on Tuesday. Indeed, spot keeps the trade below the 1.1400 mark amid acceptable losses in the US Dollar, all following rising optimism of a US-Iran deal and steady caution prior to the FOMC gathering on Wednesday.

Gold bounces on poor US data

Gold remains under marked downside pressure on Tuesday, although the $4,000 zone per troy ounce emerges as a decent support for now. The precious metal’s pullback comes despite the modest losses in the US Dollar in a context of easing geopolitical tensions ahead of the key Fed event on Wednesday.

XRP falls toward $1.00 despite dwindling exchange reserves
Ripple (XRP) continues to trade under increasing pressure on Tuesday. This marks the second consecutive day of declines, reflecting broader risk-off sentiment as investors appear to shift gears in anticipation of the Federal Reserve (Fed) interest rate decision. On Wednesday, the Federal Open Market Committee (FOMC) is widely expected to leave interest rates unchanged in the 3.50%-3.75% range.
Warning signs in the stock market: Is this the top, or just a very short fuse?
Overnight, South Korea's Kospi fell more than 10%, SK Hynix lost close to 15% and Samsung Electronics lost 13%. Into that, Dow Jones Industrial Average futures traded up around 1% on paint and soft drinks, and S&P 500 futures sat roughly flat. An index that absorbs a memory-chip panic and prints nothing is not a calm market.
US Dollar mid-year outlook: Exceptional currency, exceptional risks?
The US Dollar enters the second half of 2026 in a markedly different position from a year ago. The King currency has recovered, reflecting persistent US inflation, changing expectations for Fed policy, geopolitical tensions and renewed demand for defensive assets.