- S&P 500: A weekly close above the mid-point of an ascending channel opens the doors for a further upside move.
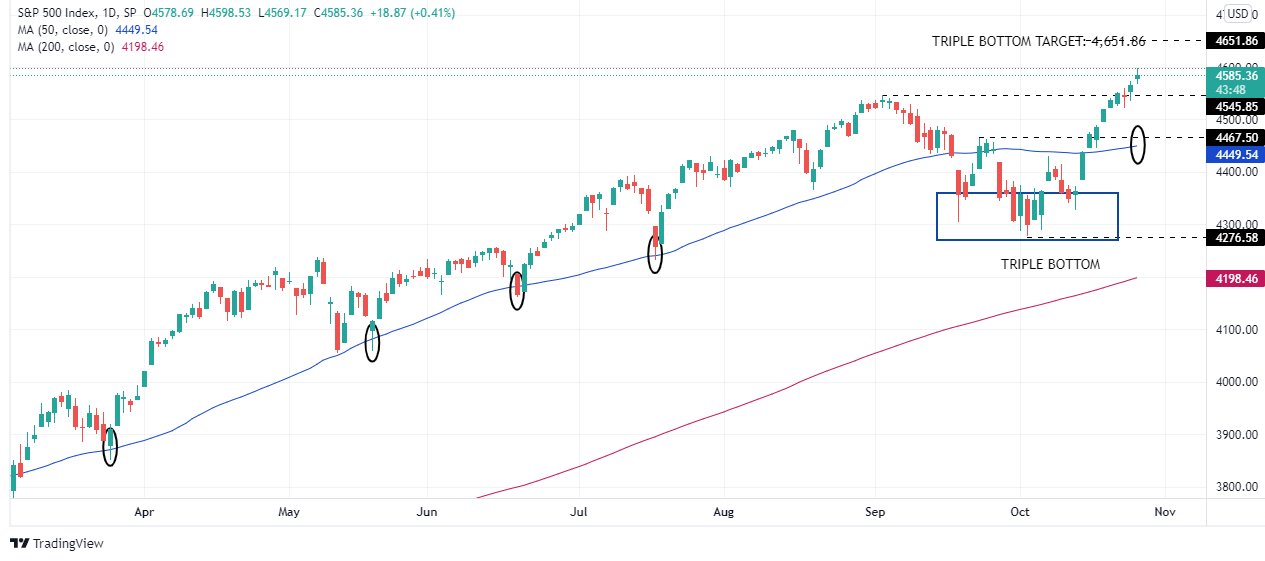
- S&P 500: A triple bottom in the daily chart puts 4,651.86 as the next upside target for bulls.
The S6P advances during the New York session, is up 0.35%, sitting at 4580.93 at the time of writing. The market sentiment is upbeat, portrayed by major US stock indices, rising between 0.26% and 0.35%.
Factors like solid US corporate third-quarter earnings have kept investors positive, despite elevated prices and central bank pandemic-stimulus reduction, which in part tries to curb inflationary pressures around the globe.
S&P 500 Price Forecast: Technical outlook
Weekly chart
The S&P 500 has rallied almost 112%, from March 23, 2020, until October 26, 2021. At press time, it is trading briefly above the mid-point line of an ascending channel, leaving the door open for an upward move towards the top of the ascending channel, which lies around the 4,800-4,900 area. A weekly close above the mid-line would open the door towards the abovementioned, but it would find resistance areas at the round levels, such as 4,600, followed by 4,700.
The Relative Strength Index (RSI), a momentum indicator that approaches 68, aims higher, indicating that the index still has the potential of printing another leg-up before reaching overbought levels.
Daily chart
The S&P 500 is in an overextended upward trend which has found strong support around the 50-day moving average (DMA), which has successfully supported the index eight times before resuming the upward direction. Nevertheless, on September 20, it finally breached below the 50-DMA, finding consolidation around the 4,300-4,500 area, which printed a triple bottom.
The measure of the bottom of the triple bottom to the “neckline” (if it could be called like this) is 186.46 points, which added to the September 23 high at 4,465.40, puts the 4,651.86 figure as the next upside target for the S&P 500.
In the outcome of a downward correction, the first support would be the September 2 high at 4,545.85, followed by the September 23 high at 4,465.40.
The Relative Strenght Index (RSI) is at 69. Edces slightly up, indicates that the S&P 500 might consolidate, before printing another leg-up.
Information on these pages contains forward-looking statements that involve risks and uncertainties. Markets and instruments profiled on this page are for informational purposes only and should not in any way come across as a recommendation to buy or sell in these assets. You should do your own thorough research before making any investment decisions. FXStreet does not in any way guarantee that this information is free from mistakes, errors, or material misstatements. It also does not guarantee that this information is of a timely nature. Investing in Open Markets involves a great deal of risk, including the loss of all or a portion of your investment, as well as emotional distress. All risks, losses and costs associated with investing, including total loss of principal, are your responsibility. The views and opinions expressed in this article are those of the authors and do not necessarily reflect the official policy or position of FXStreet nor its advertisers. The author will not be held responsible for information that is found at the end of links posted on this page.
If not otherwise explicitly mentioned in the body of the article, at the time of writing, the author has no position in any stock mentioned in this article and no business relationship with any company mentioned. The author has not received compensation for writing this article, other than from FXStreet.
FXStreet and the author do not provide personalized recommendations. The author makes no representations as to the accuracy, completeness, or suitability of this information. FXStreet and the author will not be liable for any errors, omissions or any losses, injuries or damages arising from this information and its display or use. Errors and omissions excepted.
The author and FXStreet are not registered investment advisors and nothing in this article is intended to be investment advice.
Recommended content
Editors’ Picks
AUD/USD slips below 0.6700 amid hawkish Fed stance despite RBA’s minutes
The Australian Dollar registered losses of 0.03% against the US Dollar as Federal Reserve officials hitting the wires were reluctant to hint at when rate cuts begin. Consequently, US Treasury bond yields fell, while the Greenback stood tall, flat at around 104.62. The AUD/USD trades at 0.6668 as Wednesday’s Asian session begins.
EUR/USD flattens out near 1.0850 as data looms
EUR/USD stuck closely to familiar levels on a sedate Tuesday market session. Talking points from Fed officials dominated headlines, but provided little new information for investors to digest, keeping risk appetite suppressed and stapling bids close to opening prices.
Gold retreats from peak high amid Fed wary stance
Gold price retraces during Tuesday’s North American session after hitting an all-time high of $2,450. Yet it retreated below the April 12 high of $2,431 as the Greenback recovers some ground. The XAU/USD trades around $2,418, after reaching a high of $2,433.
DeFi and Layer 2 coins rally following Ethereum's rise
Ethereum ecosystem tokens have surged following ETH's recent rally after optimism that the Securities & Exchange Commission would approve spot ETH ETFs.
RBNZ expected to keep key interest rate on hold as inflation pressures persist
The Reserve Bank of New Zealand is widely anticipated to maintain the OCR at 5.50%. The language in the policy statement is expected to remain hawkish. The New Zealand Dollar has room to extend its bullish momentum.