S&P 500 Forecast: Surprise OPEC+ oil cut brings worries to stock market
- OPEC+ cuts supply by 1.16 million barrels per day.
- S&P 500 returns 3.5% in March.
- S&P 500's close above 4,100 on Friday major bullish signal.

Sunday's unexpected oil supply cut announcement by OPEC+ is rattling the market here on Monday. Thus far the futures market shows traders cutting growth stocks and reinvesting in the Dow's blue chips. This week is shortened due to the stock market closing for Good Friday. Still several economic indicators should provide direction to equity movements, especially for the S&P 500 index. Both the ISM PMIs for manufacturing and services will tell investors the current state of the economy, and Thursday's initial jobless claims should also provide insight on the labor market.
Last week the S&P 500 index returned 3.5% last week. Not bad! While Monday and Tuesday saw the index trade sideways, the last half of the week made all the difference. As luck would have it, the S&P 500 returned 3.5% for both last week and the full month of March.
At the time of writing on Monday morning, NASDAQ 100 futures are down 0.7%, while Dow futures rise 0.4%. S&P 500 futures are flat to down.
S&P 500 news: OPEC+ production cut could push up inflation
The price of a barrel of oil rose 8% on Monday after OPEC+ decided to front-run the OPEC Joint Ministerial Monitoring Committee that is scheduled to meet on Monday. On Sunday, the group of oil exporting countries said they would cut production by 1.16 million barrels a day with both Russia and Saudi Arabia expected to reduce supply by 500,000 barrels a day. This comes on top of the 2 million barrels a day that were cut at the last meeting. The cut will not begin until May, but already many observers are predicting that the pre-emptive price rises could mean higher inflation.
The White House said it was the wrong time to cut supply, but it appears many producers are worried about slackening demand, especially in case the much-predicted recession hits the US economy in the back half of the year. The Federal Reserve meets again in May, and pundits think rising oil prices may lead the central bank to hike interest rates yet again. The expectation of a hike would almost certainly lead to lower equity valuations ahead of any announcement.
ISM PMIs, jobless claims await
The Institute for Supply Management (ISM) will release its March purchasing managers index (PMI) for manufacturing during Monday's trading session. This snapshot of the health of US manufacturing will give traders a better view on where the US economy is headed. Market consensus expects a reading of 47.5, slightly below February's 47.7. On Wednesday, the ISM releases the Services PMI for March. Here again the current forecast calls for February's 55.1 reading to drop to 54.5 in March.
On Thursday, Wall Street expects the Commerce Department to report initial jobless claims for the week ending March 31 of 200K, slightly above the previous week's 198K. If the 4-week average of 198,250 ticks higher, then the S&P 500 may rally. This is because evidence that the tight labor market is loosening will lead traders to think that inflation, and thus interest rates, is headed lower.
Earnings of the week
Monday, April 3 - Curaleaf Holdings (CURLF), Manchester United (MANU)
Tuesday, March 28 - Tilray (TLRY)
Wednesday, March 29 - Conagra Brands (CAG), Dlocal (DLO)
Thursday, March 30 - Constellation Brands (STZ), Levi Straus (LEVI)
S&P 500 quote
Ole Hansen, head of commodity strategy at Saxo Bank A/S, gave color on OPEC+'s decision to cut production by 1.16 million barrels a day starting in May:
“The decision was made to ensure stability and to pre-empt a potential slowdown in global demand growth.”
S&P 500 technical analysis
Despite the bearish turn on Monday caused by higher oil prices, the S&P 500 closed above 4,100 last Friday at 4,109. That close put the index above the double top from December 1 and 13 of last year and was a clear bullish sign. Interestingly, the weekly close also came directly on top of the bottom trendline that the S&P 500 broke below on February 24.
The index might be retesting the price channel that worked since June of last year. If the S&P 500 fails to break above that trendline this week, forget about breaking December's double top formation and expect that the future is down for the index. A failure to break above the trendline should mean the index retraces its steps back to 3,800. Traders will know for sure if price action closes below the 21-day moving average, which is currently at 3,968.
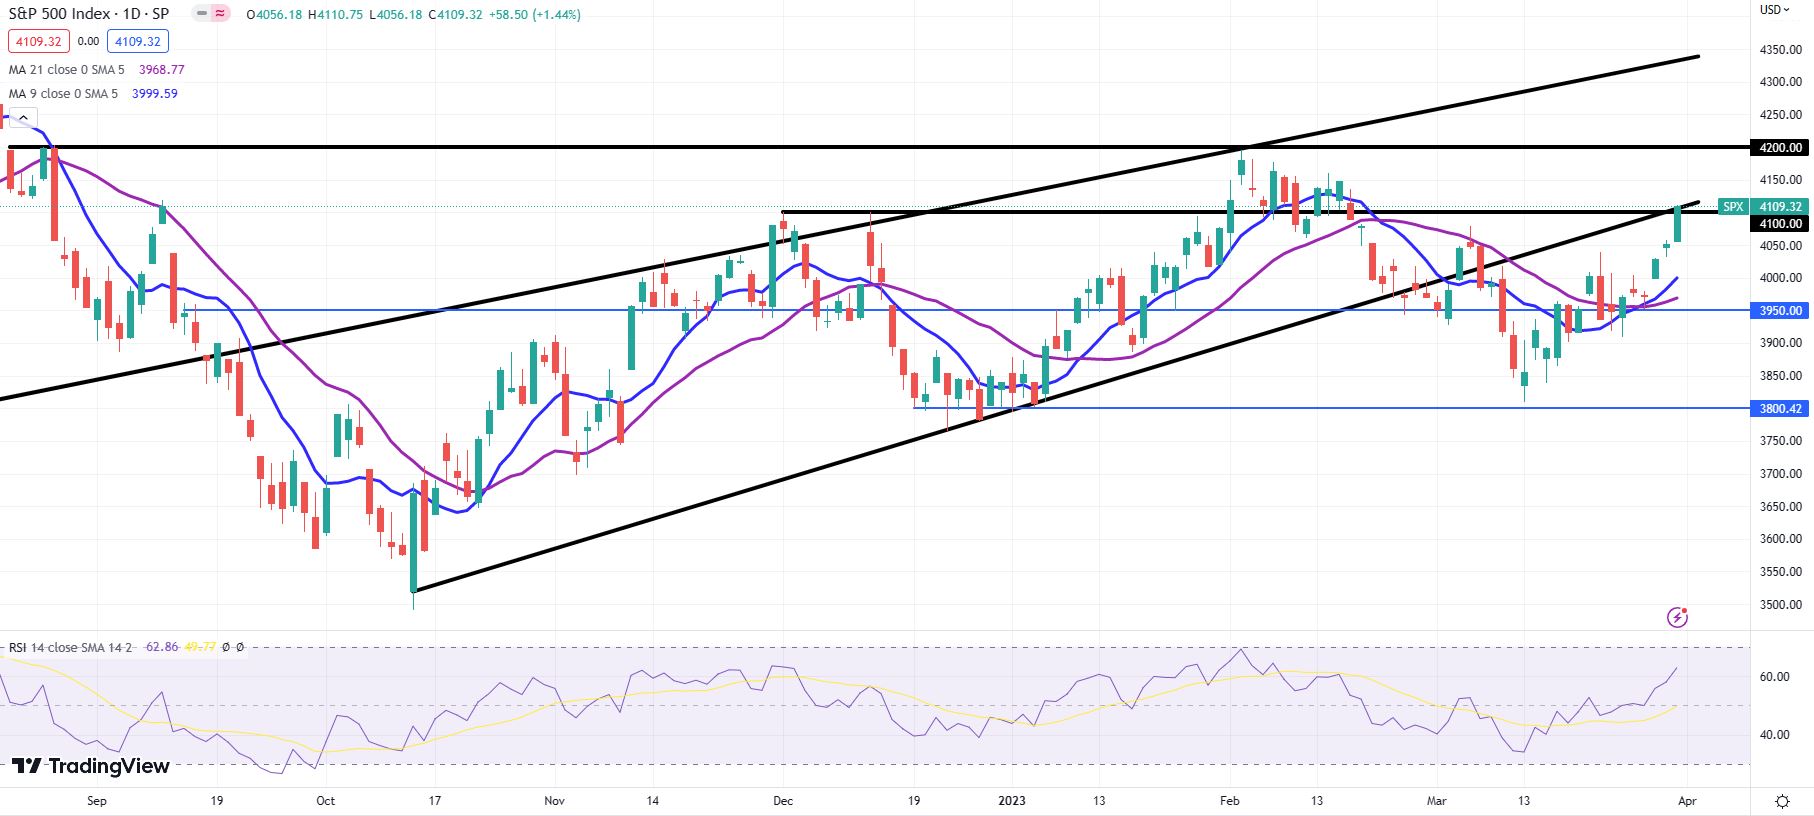
S&P 500 daily chart
Author

Clay Webster
FXStreet
Clay Webster grew up in the US outside Buffalo, New York and Lancaster, Pennsylvania. He began investing after college following the 2008 financial crisis.















