S&P 500 Elliott Wave count warns of correction as breadth divergence deepens

In our update from May 18, when the S&P500 (SPX) was trading at around $7,385, we showed using the Elliott Wave Principle that a small pullback (a 4th wave) to ideally $7,310-7,420 would precede a rally (a 5th wave) to the 376.4-400.0% Fibonacci extensions at $7,650-7,720.
Figure 1. Short-term Elliott Wave count with technical indicators for the SP500
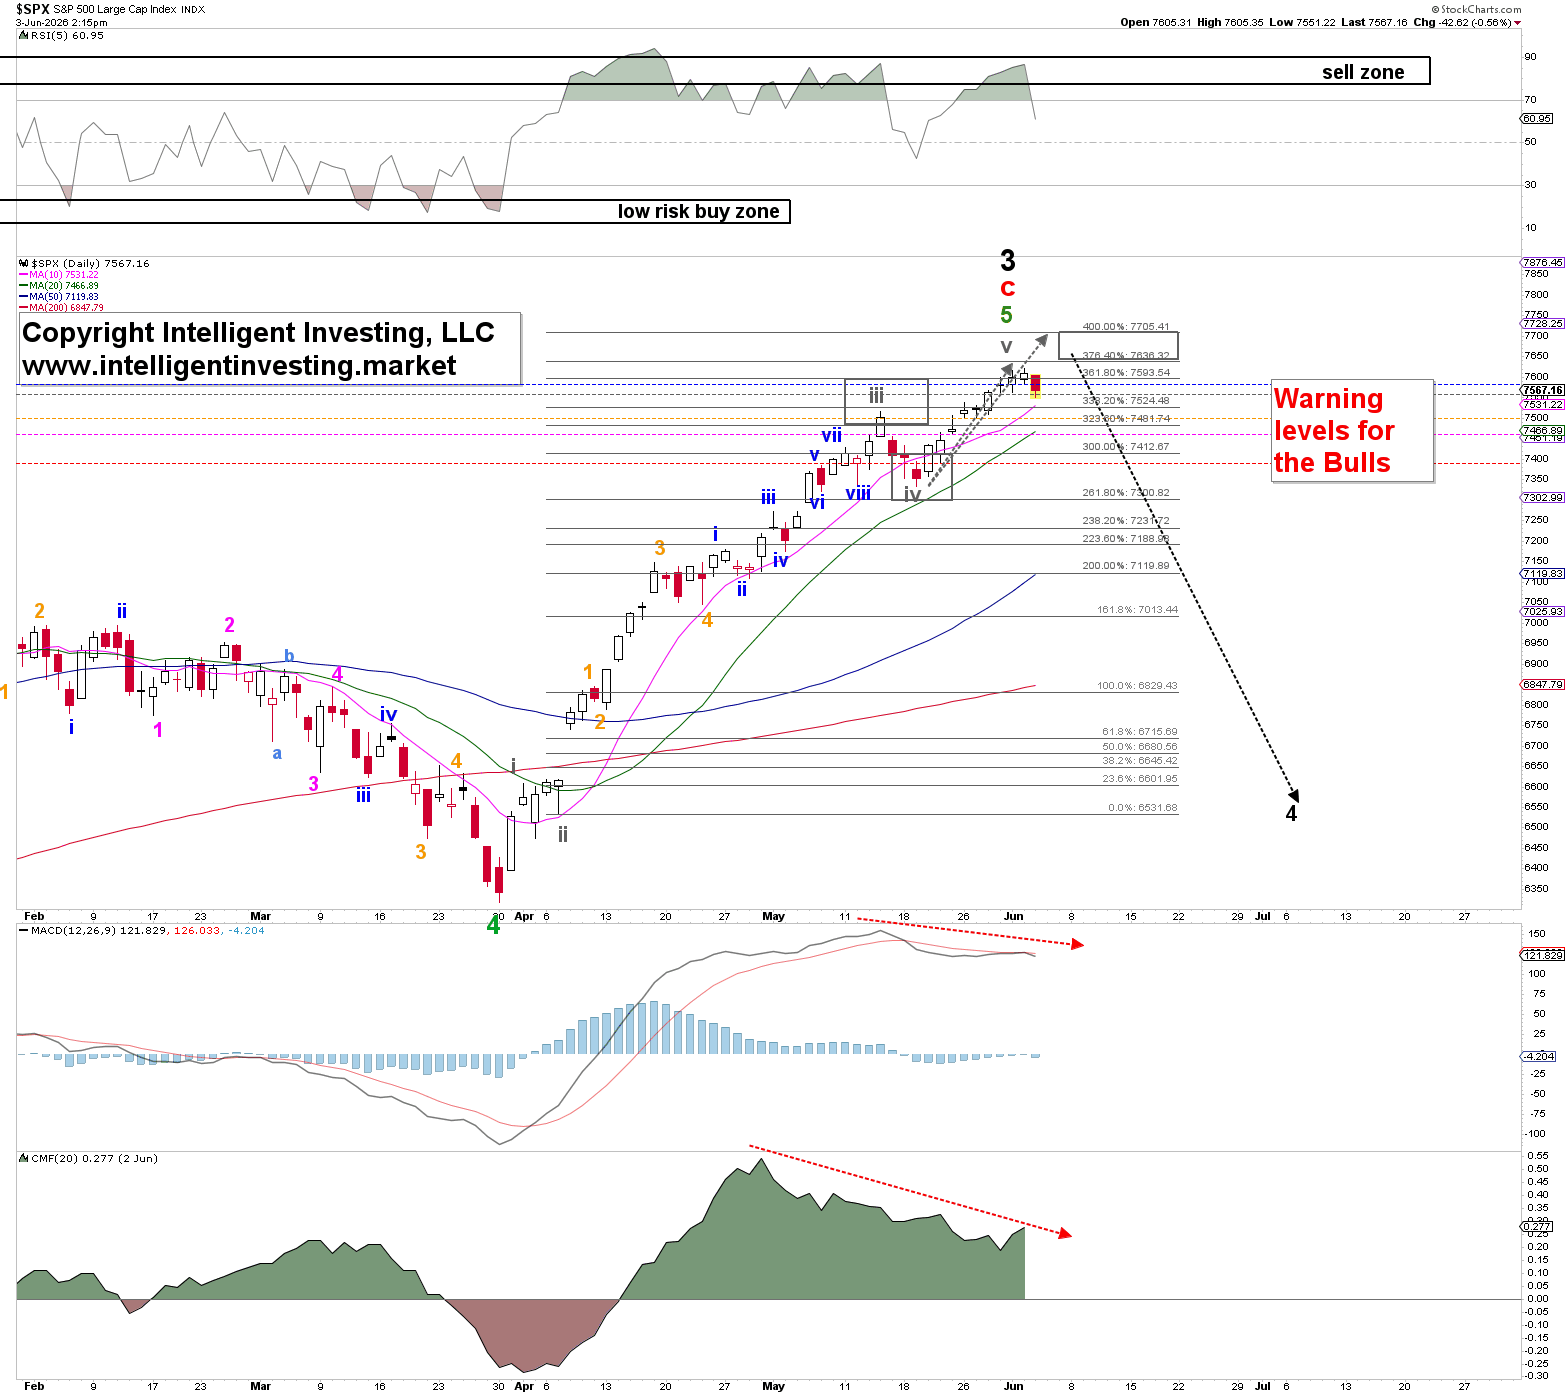
Fast-forward to today: the index bottomed out at $7,333 on May 19 for the gray Wave-iv. It staged a rally, which peaked yesterday, June 2, at $7,620 for the gray W-v. 0.4% shy of the ideal target zone set forth two-and-a-half weeks ago. The index has most likely begun its decline today, as negative divergences (red dotted arrows on the technical indicators) continued to build.
In our previous update, we shared the index’s cumulative advancing/declining line, which continued to show fewer participants even as the S&P 500 rallied. Two-and-a-half weeks later, the divergence has only worsened. See the black box in Figure 2 below.
Figure 2. Cumulative A/D line for the SP500
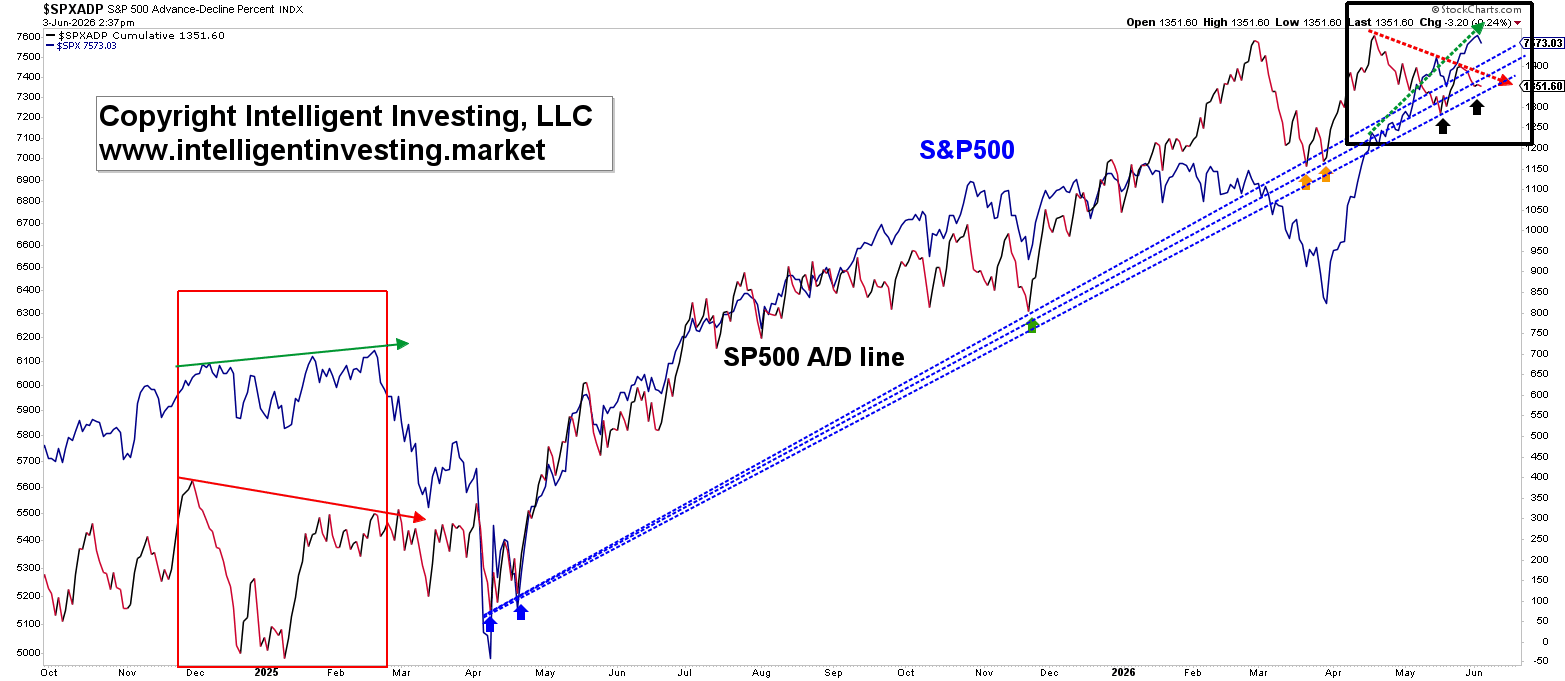
While prices have been moving toward new highs, the cumulative A/D has rolled over and failed to confirm — a classic warning sign of weakening market breadth. This isn’t just noise. When the broad market (advancers vs. decliners) no longer supports the index rally, it often signals a pullback or trend reversal.
Key observations from the chart:
· Multiple failed attempts by the A/D line to make new highs
· Price is making higher highs while the A/D makes lower highs
· Recent breakdown in the A/D line as price stalls
Breadth divergences don’t always trigger immediate crashes, but they’ve historically signaled many important tops. See, for example, the red box in Figure 2 above.
Since our last update, there has been a smaller 4th-wave pullback to $7,310-7,420 (gray W-iv at $7,333), followed by a rally to $7,650-7,720 (gray W-v to $7,620), exactly as forecast by the EWP. Though another rally to ~$7,740 after a ~5% drop can’t be ruled out just yet (not shown), the weight of the evidence points toward a large-degree decline that could last several months.
Author

Dr. Arnout Ter Schure
Intelligent Investing, LLC
After having worked for over ten years within the field of energy and the environment, Dr.














