S&P 500 Elliott Wave: Breadth divergence warns as only big names hold the uptrend

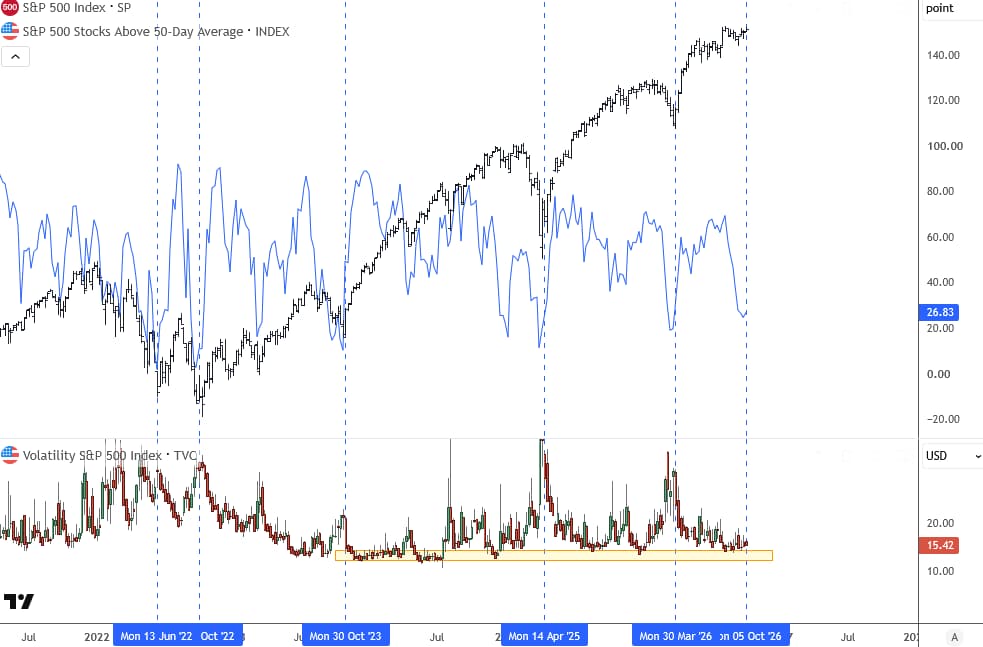
The S&P 500 is still trading near its highs, but the picture underneath is much weaker. Fewer than 30% of S&P 500 stocks are currently above their 50-day moving average (26.8 on the chart), which means only the big names are keeping this uptrend in play.
That's a divergence worth watching. If you look at the chart, the previous times breadth dropped this low, in June and October 2022, October 2023, April 2025 and March 2026, the S&P 500 was also under pressure and making a low. This time the index is near the highs while most stocks are lagging behind. The equal-weight S&P 500 is turning down, which confirms that the rally is narrow.
At the same time, the VIX is sitting at the lower end of its range around 15, so the market is not pricing in much risk.
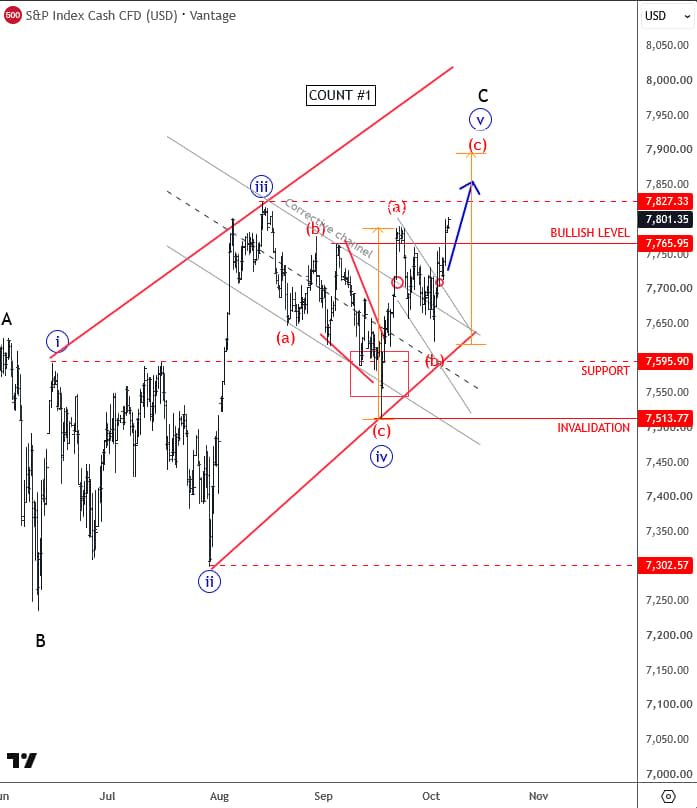
From an Elliott Wave perspective, the S&P 500 bounced from the 61.8% retracement support and can still see continuation higher for a final leg of an ending diagonal. The Nasdaq 100 looks stronger and can continue higher as long as it trades above its trendline, while the Dow Jones and the Russell 2000 show five-wave declines from the highs, so their rebounds may be temporary.
Positioning in the broader market is already getting quite bearish, which often leads to a rebound first. But with tech names such as Microsoft approaching resistance around 540–550 and Nvidia losing momentum near 250, the risk of a bigger reversal is rising. Some rotation from mega caps into the rest of the market is also possible.
We talked about this in yesterday's Elliott Wave Live webinar, you can watch the replay here:

Get Full Access To Our Premium Elliott Wave Analysis For 14 Days. Click here.
Author

Gregor Horvat
Wavetraders
Experience Grega is based in Slovenia and has been in the Forex market since 2003.

















