|

S&P 500 E-Mini (ES_F) Elliott Wave: Forecasting the future path

In this technical article, we’re going to take a quick look at the Elliott Wave charts of the S&P 500 E-Mini (ES_F Futures) , published in the members area of the website.

As our members know, $ES_F recently provided a solid trading setup. The main outlook remains bullish, with the market currently correcting the cycle from the August 5812.28 low.

In this article, we’ll explain our forecast and the best way to approach trading $ES_F.

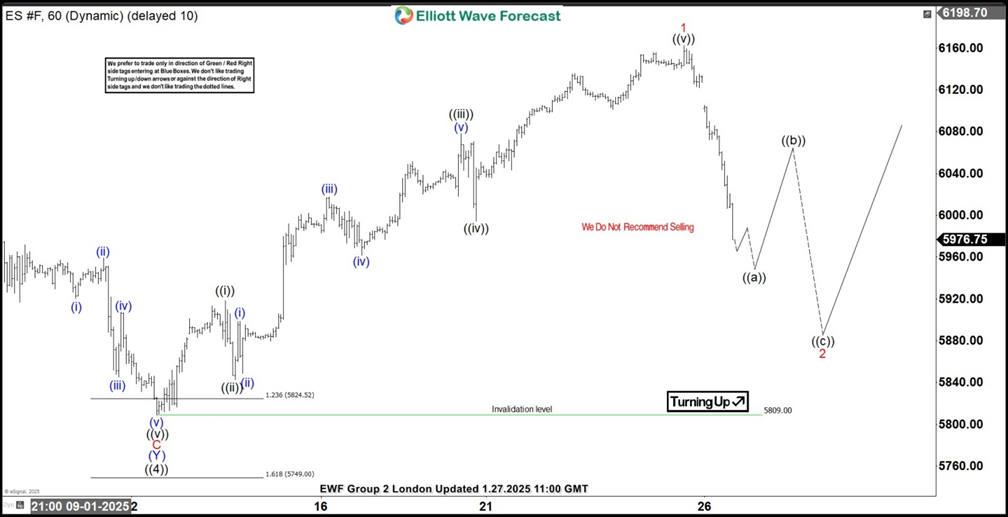
ES_F Elliott Wave one-hour chart 01.27.2025

Futures show an impulsive decline from the peak. Consequently, we assume that the price is nearing the completion of the first leg of a deeper wave 2 (red) pullback, unfolding as a Zig-Zag pattern. We expect to see a three-wave bounce in ((b)), followed by another leg down in wave 2 (red). The final target for wave 2 (red) will depend on how far wave ((b)) extends to the upside.

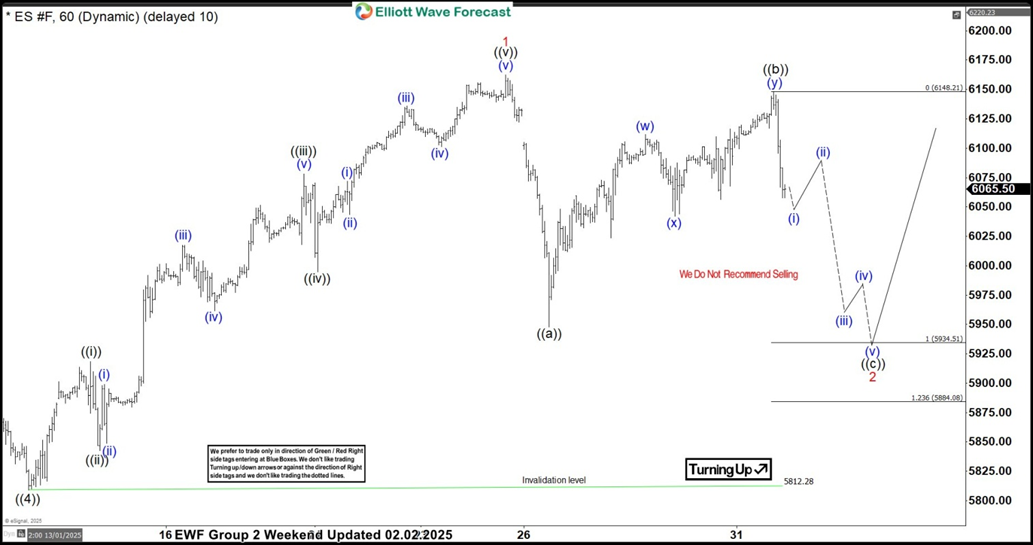
ES_F Elliott Wave one-hour chart 02.02.2025

$ES_F has completed a clear five-wave decline from the peak—((a)) in black—followed by a three-wave bounce in ((b)), as anticipated. The market is now likely in the final ((c)) leg of the correction.As long as the price remains below the 6148.21 peak, $ES_F  can see a drop toward the 5934.5–5884 area to complete wave 2 (red) before resuming the larger trend.

If you’re not already long and risk-free from the previous blue box area, the best approach to trading $ES_F would be to wait for a break above the 1 red peak. Once that happens, we can look for an intraday pullback to buy the dips in the 3, 7, and 11 swings. 

Author

Elliott Wave Forecast Team

Elliott Wave Forecast Team

ElliottWave-Forecast.com

More from Elliott Wave Forecast Team
Share:

Editor's Picks

EUR/USD bounces off lows, back to 1.1860

EUR/USD now manages to regain some balance, retesting the 1.1860-1.1870 band after bottoming out near 1.1830 following the US NFP data on Wednesday. The pair, in the meantime, remains on the defensive amid fresh upside traction surrounding the US Dollar.

GBP/USD rebounds to 1.3660, USD loses momentum

GBP/USD trades with decent gains in the 1.3660 region, regaining composure following the post-NFP knee-jerk toward the 1.3600 zone on Wednesday. Cable, in the meantime, should now shift its attention to key UK data due on Thursday, including preliminary GDP gauges.

Gold stays bid, still below $5,100

Gold keeps the bid tone well in place on Wednesday, retargeting the $5,100 zone per troy ounce on the back of humble gains in the US Dollar and firm US Treasury yields across the curve. Moving forward, the yellow metal’s next test will come from the release of US CPI figures on Friday.

Ripple Price Forecast: XRP sell-side pressure intensifies despite surge in addresses transacting on-chain 

Ripple (XRP) is edging lower around $1.36 at the time of writing on Wednesday, weighed down by low retail interest and macroeconomic uncertainty, which is accelerating risk-off sentiment.

US jobs data surprises to the upside, boosts stocks but pushes back Fed rate cut expectations

This was an unusual payrolls report for two reasons. Firstly, because it was released on  Wednesday, and secondly, because it included the 2025 revisions alongside the January NFP figure.

XRP sell-off deepens amid weak retail interest, risk-off sentiment

Ripple (XRP) is edging lower around $1.36 at the time of writing on Wednesday, weighed down by low retail interest and macroeconomic uncertainty, which is accelerating risk-off sentiment.