|

S&P 500 could rally to 7,700 before summer weakness

As you know, we had been calling for consolidation on the S&P 500 during June based on the seasonal pattern. But if you now look at July, history shows that when stocks consolidated in June, they often broke higher during the middle of summer before another consolidation phase developed in August and September.

Now, if we combine this seasonal pattern with our Elliott Wave count, we can see a pretty interesting setup. The S&P 500 is currently testing the trend line resistance connected from the June highs, and we think this trend line could be broken, allowing for more upside in the near term, possibly towards the 7700 area.
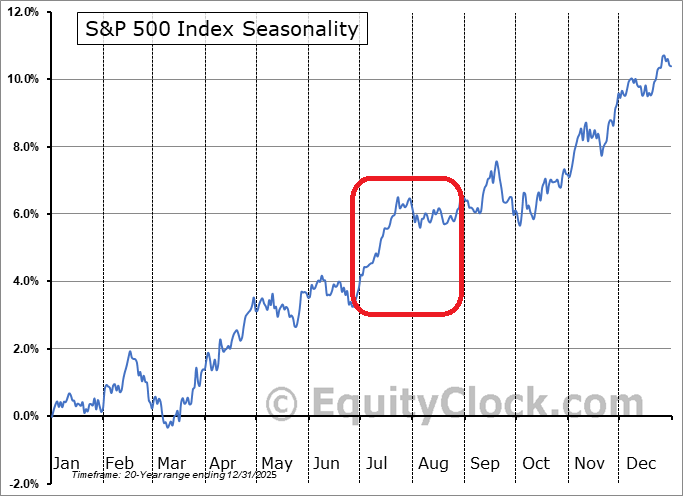
However, 7700 could become a very important resistance zone, especially if we consider that the market may start consolidating again during August. In our view, this could happen after a wave B rally as part of a larger flat correction.

One of the reasons why we think wave four could become more complex after new highs are reached is because it's very rare to see wave four take less time to unfold than wave two. Also, look at the structure of wave two—it was a complex and overlapping W-X-Y correction. If we apply the Elliott Wave rule of alternation, it's very possible that wave four this time will form a flat correction instead.

If we see a decline towards the end of the summer, then the 7200 to 7100 area could become a very attractive support zone for the market to stabilize before the larger uptrend resumes.
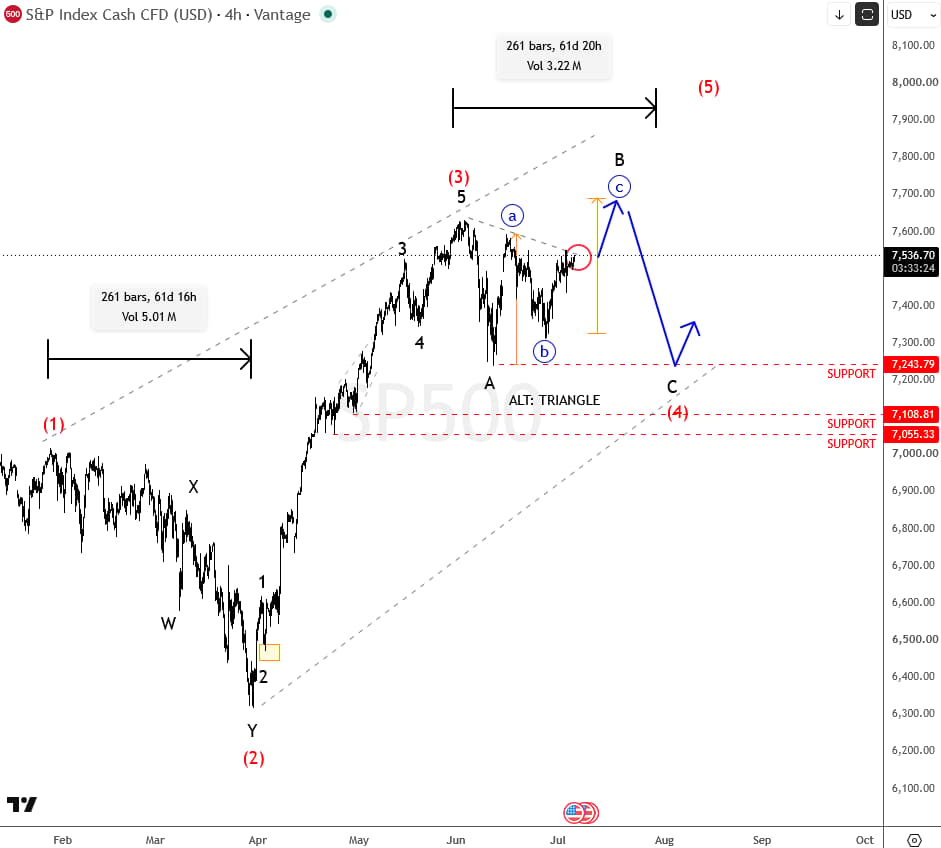
So the bottom line is that we could still see more upside in the short term, but once the market reaches fresh all-time highs, especially towards the end of July, that's when we should become much more cautious about a potential slowdown and another corrective phase.


Get Full Access To Our Premium Elliott Wave Analysis For 14 Days. Click here.

Author

Gregor Horvat

Gregor Horvat

Wavetraders

Experience Grega is based in Slovenia and has been in the Forex market since 2003.

More from Gregor Horvat
Share:

Editor's Picks

GBP/USD dips below 1.3350 with bullish momentum losing steam

The British Pound ticks lower against the US Dollar Monday, attempting to close a seven-day rally, as tensions rise again in the Strait of Hormuz, one of the critical points in the peace process between Washington and Tehran. The GBP/USD pair trades near 1.3340 at the time of writing, down from 1.3387 highs last week, although it maintains a near-term bullish trend intact.

EUR/USD trims losses, back to 1.1430

EUR/USD remains under pressure on Monday, although it now manages to trim its earlier losses and return to the 1.1430 zone, down marginally for the day. The pair’s mild pullback comes on the back of modest gains in the US Dollar in quite an apathetic start to the week.

Gold meets resistance around $4,200

Gold comes under fresh downside pressure on Monday, reversing three daily upticks in a row and meeting some initial resistance around the $4,200 mark per troy ounce. Safe-haven demand has shifted toward the US Dollar as renewed tensions surrounding the Strait of Hormuz weigh on market sentiment, limiting the precious metal's upside.

Crypto Today: Bitcoin, Ethereum, XRP pull back amid persistent ETF outflows

The cryptocurrency market is experiencing widespread weakness on Monday, with Bitcoin (BTC) sliding under the $63,000 mark amid ongoing risk aversion.

The US Dollar just beat the Swiss Franc at its own safe-haven game

As the king among safe havens, the Swiss Franc is supposed to benefit from geopolitical shocks such as the Iran war. This time, it didn’t. The Swissie is nearly 6% below January’s peak against the USD after a sharp decline that came along with the war in Iran and the closure of the Strait of Hormuz.

Kevin Warsh offers no policy clues: Why markets still got their answer

Financial markets came to Sintra looking for clues about the Federal Reserve's (Fed) next move. They largely left with confirmation that Fed Chair Kevin Warsh intends to make those clues much harder to find.















