Silver trades sideways as US-Iran war tensions and technical barriers weigh on XAG/USD
- Silver trades in a narrow range as US-Iran war headlines keep markets cautious.
- Initial optimism over a potential ceasefire faded amid conflicting headlines on ceasefire negotiations.
- Technically, XAG/USD remains under pressure below the 100-day SMA, keeping the near-term bias weak.
Silver (XAG/USD) trades in a narrow range on Monday as geopolitical tensions in the Middle East keep markets on edge, while traders refrain from placing aggressive directional bets amid conflicting headlines over efforts to end the US-Iran war.
At the time of writing, XAG/USD is trading around $73, with modest US Dollar softness helping cushion the downside. However, upside remains capped as rising Oil prices fuel inflation concerns and reinforce expectations that the Federal Reserve (Fed) will keep interest rates higher for longer.
Earlier on Monday, optimism rose following reports from Axios that the US and Iran, along with regional mediators, are discussing a potential 45-day ceasefire.
However, that optimism proved short-lived after IRNA reported that Iran rejected a ceasefire proposal conveyed via Pakistan and submitted a 10-point response. The proposal reportedly includes demands such as an end to conflicts in the region and a framework for safe passage through the Strait of Hormuz.
No meaningful breakthrough has emerged, with attention now turning to the deadline set by US President Donald Trump, due on Tuesday at 8:00 p.m. Eastern Time. Trump has warned of strikes on Iran’s energy and civilian infrastructure if the Strait of Hormuz is not reopened.
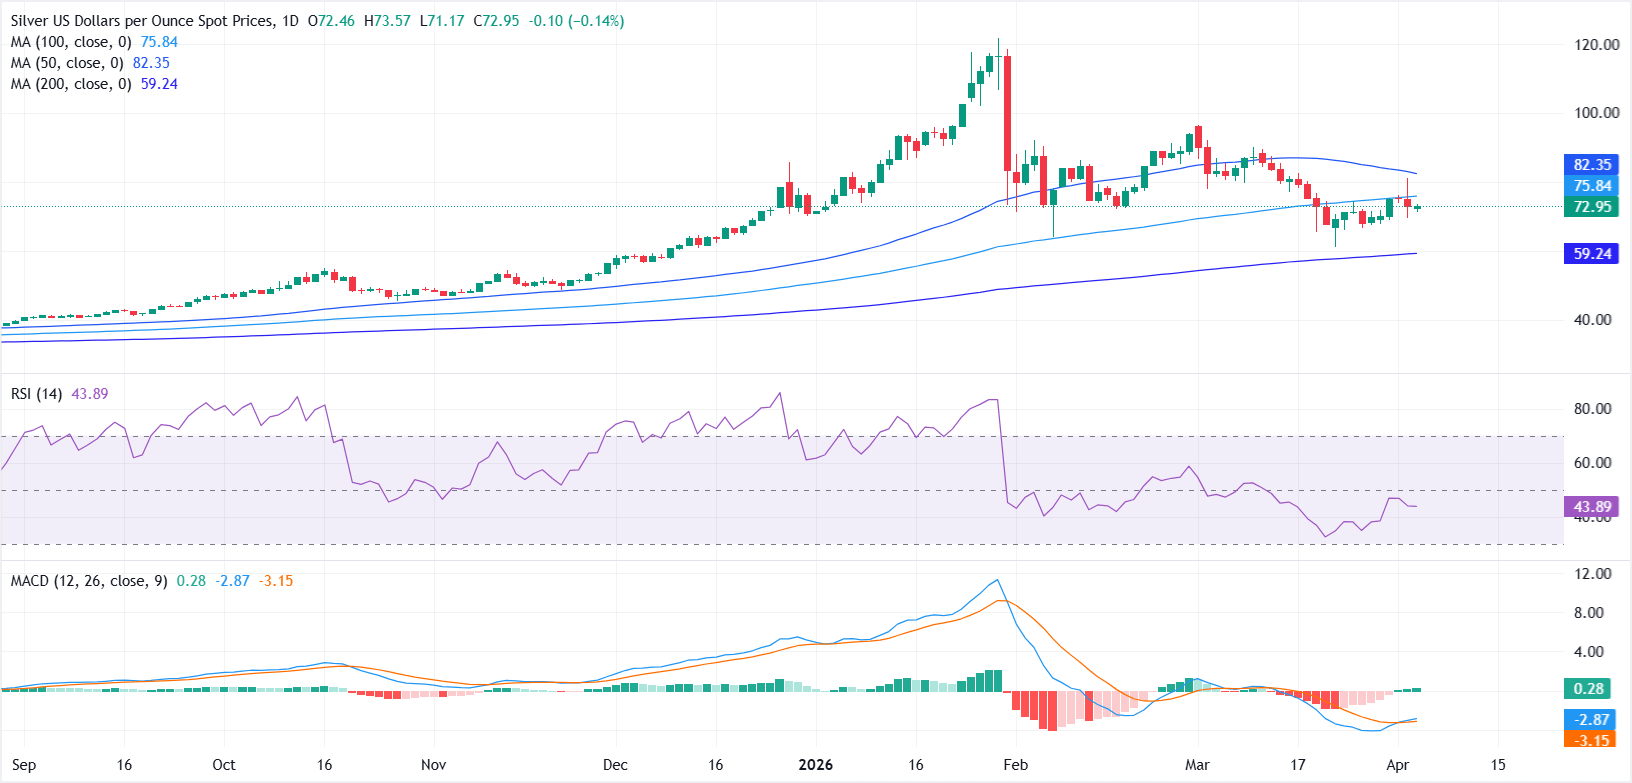
From a technical perspective, XAG/USD maintains a bearish-to-neutral outlook, with repeated rejection near the 100-day Simple Moving Average (SMA) and price holding well below the 50-day SMA.
Initial resistance is seen at the 100-day SMA at $75.84 and a sustained move above this level could pave the way toward the 50-day SMA around $82.35. Beyond that, the February swing high near $96.62 stands as the next major upside barrier.
On the downside, immediate support lies in the $70-$68 zone, followed by the March low near $61.01, which aligns closely with the 200-day SMA at $59.24.
The Relative Strength Index (RSI) at 43 points to persistent but not extreme selling pressure. Meanwhile, the Moving Average Convergence Divergence (MACD) indicator has turned slightly positive but remains near the zero line, suggesting that downside momentum is fading but not yet fully reversed.
Silver FAQs
Silver is a precious metal highly traded among investors. It has been historically used as a store of value and a medium of exchange. Although less popular than Gold, traders may turn to Silver to diversify their investment portfolio, for its intrinsic value or as a potential hedge during high-inflation periods. Investors can buy physical Silver, in coins or in bars, or trade it through vehicles such as Exchange Traded Funds, which track its price on international markets.
Silver prices can move due to a wide range of factors. Geopolitical instability or fears of a deep recession can make Silver price escalate due to its safe-haven status, although to a lesser extent than Gold's. As a yieldless asset, Silver tends to rise with lower interest rates. Its moves also depend on how the US Dollar (USD) behaves as the asset is priced in dollars (XAG/USD). A strong Dollar tends to keep the price of Silver at bay, whereas a weaker Dollar is likely to propel prices up. Other factors such as investment demand, mining supply – Silver is much more abundant than Gold – and recycling rates can also affect prices.
Silver is widely used in industry, particularly in sectors such as electronics or solar energy, as it has one of the highest electric conductivity of all metals – more than Copper and Gold. A surge in demand can increase prices, while a decline tends to lower them. Dynamics in the US, Chinese and Indian economies can also contribute to price swings: for the US and particularly China, their big industrial sectors use Silver in various processes; in India, consumers’ demand for the precious metal for jewellery also plays a key role in setting prices.
Silver prices tend to follow Gold's moves. When Gold prices rise, Silver typically follows suit, as their status as safe-haven assets is similar. The Gold/Silver ratio, which shows the number of ounces of Silver needed to equal the value of one ounce of Gold, may help to determine the relative valuation between both metals. Some investors may consider a high ratio as an indicator that Silver is undervalued, or Gold is overvalued. On the contrary, a low ratio might suggest that Gold is undervalued relative to Silver.
Author

Vishal Chaturvedi
FXStreet
I am a macro-focused research analyst with over four years of experience covering forex and commodities market. I enjoy breaking down complex economic trends and turning them into clear, actionable insights that help traders stay ahead of the curve.