Silver Price reverses as bearish-engulfing pattern hints at further losses
- Bearish engulfing pattern confirms rejection at 50-day SMA resistance
- Break below Fibonacci levels reinforces short-term downtrend continuation
- Drop under $75 exposes $73.53 and $72.57 support levels

Silver price (XAG/USD) collapsed as buyers got rejected at the 50-day Simple Moving Average (SMA) at $78.73, as geopolitical headlines dominated price action on Thursday. The XAG/USD trades at $75.40, down 3%.
XAG/USD Price Forecast: Technical Outlook
The white metal is forming a ‘bearish engulfing’ pattern on the daily chart, indicating further downside lies ahead. The 20-day Simple Moving Average (SMA) serves as key support at $75.28, while immediate resistance lies at the $75.00 psychological level.
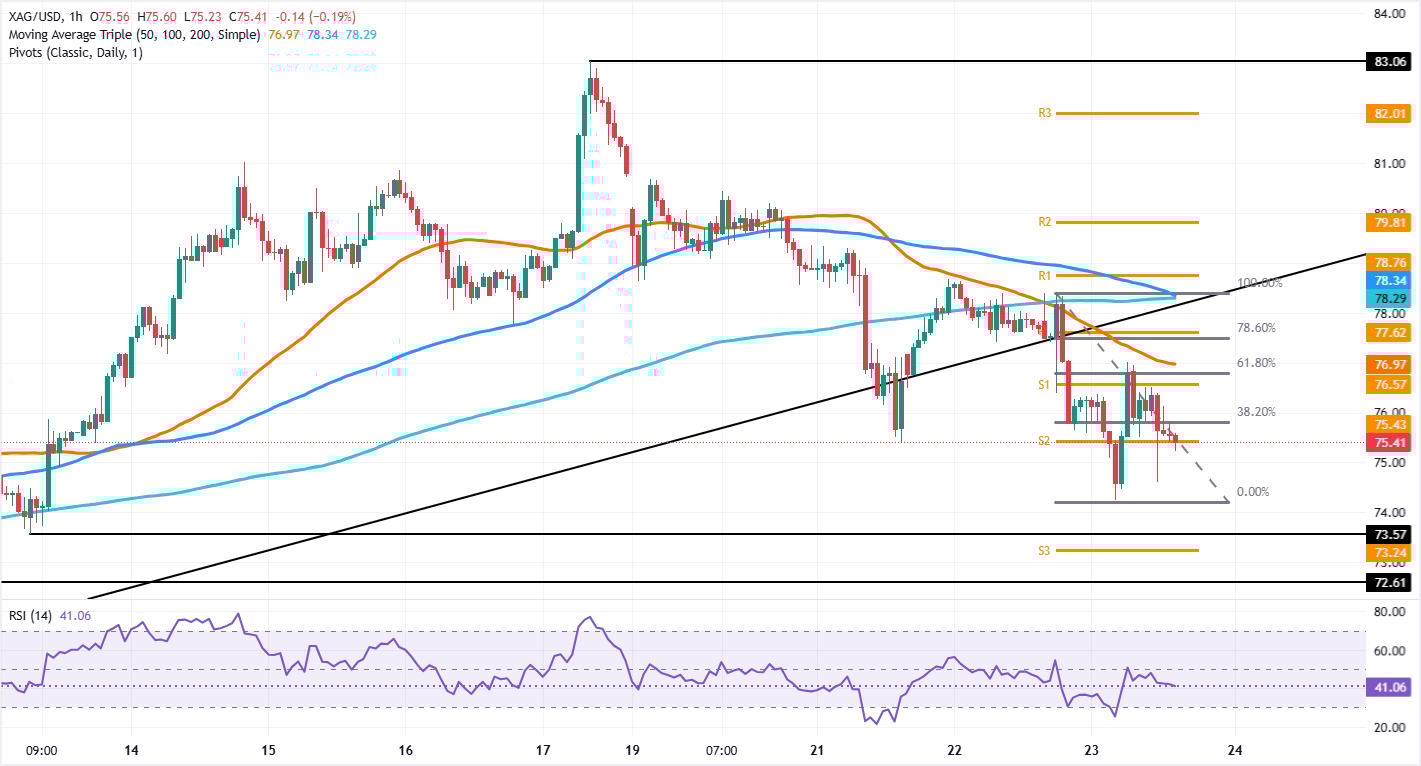
Silver’s hourly chart shows that the short-term downtrend continues after XAG tested the 61.8% Fibonacci retracement drawn from the day’s high of $78.38 to the low of $74.19. Since then, the non-yielding metal has extended its losses, surpassing the 38.2% Fibonacci level, with eyes set on $75.00 ahead of testing the daily low.
If those two levels are cleared, the next stop would be the April 13 daily low of $73.57, followed by the current week’s low of $72.61.
XAG/USD Price Chart – Hourly
Silver FAQs
Silver is a precious metal highly traded among investors. It has been historically used as a store of value and a medium of exchange. Although less popular than Gold, traders may turn to Silver to diversify their investment portfolio, for its intrinsic value or as a potential hedge during high-inflation periods. Investors can buy physical Silver, in coins or in bars, or trade it through vehicles such as Exchange Traded Funds, which track its price on international markets.
Silver prices can move due to a wide range of factors. Geopolitical instability or fears of a deep recession can make Silver price escalate due to its safe-haven status, although to a lesser extent than Gold's. As a yieldless asset, Silver tends to rise with lower interest rates. Its moves also depend on how the US Dollar (USD) behaves as the asset is priced in dollars (XAG/USD). A strong Dollar tends to keep the price of Silver at bay, whereas a weaker Dollar is likely to propel prices up. Other factors such as investment demand, mining supply – Silver is much more abundant than Gold – and recycling rates can also affect prices.
Silver is widely used in industry, particularly in sectors such as electronics or solar energy, as it has one of the highest electric conductivity of all metals – more than Copper and Gold. A surge in demand can increase prices, while a decline tends to lower them. Dynamics in the US, Chinese and Indian economies can also contribute to price swings: for the US and particularly China, their big industrial sectors use Silver in various processes; in India, consumers’ demand for the precious metal for jewellery also plays a key role in setting prices.
Silver prices tend to follow Gold's moves. When Gold prices rise, Silver typically follows suit, as their status as safe-haven assets is similar. The Gold/Silver ratio, which shows the number of ounces of Silver needed to equal the value of one ounce of Gold, may help to determine the relative valuation between both metals. Some investors may consider a high ratio as an indicator that Silver is undervalued, or Gold is overvalued. On the contrary, a low ratio might suggest that Gold is undervalued relative to Silver.
Author

Christian Borjon Valencia
FXStreet
Markets analyst, news editor, and trading instructor with over 14 years of experience across FX, commodities, US equity indices, and global macro markets.


