Silver Price Forecast: XAG/USD wobbles around $48.70 at the start of US data-packed week
- Silver price trades sideways around $48.70 at the start of the week.
- The US ISM report is expected to show that the Manufacturing PMI slightly improved to 49.2 in October.
- Fed Chair Powell argues against reducing interest rates in December.

Silver price (XAG/USD) consolidates in a tight range around $48.70 during the European trading session on Monday. The white metal starts the week on a calm note as investors await a slew of United States (US) economic data releasing this week.
Major US economic data releases include ISM Manufacturing and Services PMI, and the ADP Employment Change data for October. The US JOLTS Job Openings data for September and the Nonfarm Payrolls (NFP) data for October won’t release due to ongoing federal shutdown.
In Monday’s North American session, investors will focus on the US ISM Manufacturing PMI, which is expected to come in at 49.2. Estimated data suggests marginal improvement from September’s reading of 49.1; still, a figure below 50.0 is still considered a contraction in the business activity.
Going forward, the major trigger for the Silver price will be market expectations for the Federal Reserve’s (Fed) monetary policy action in the December policy meeting. Lately, speculation of one more interest rate cut by the Fed this year has diminished after Chair Jerome Powell argued against further monetary policy easing in December.
Fed’s Powell stated in the press conference after the monetary policy announcement on Wednesday that the December cut is “far from assured”. Powell clarified that there were “strongly different views” in the meeting, and the takeaway is that “we haven't made a decision about December", Bloomberg reported.
Silver technical analysis
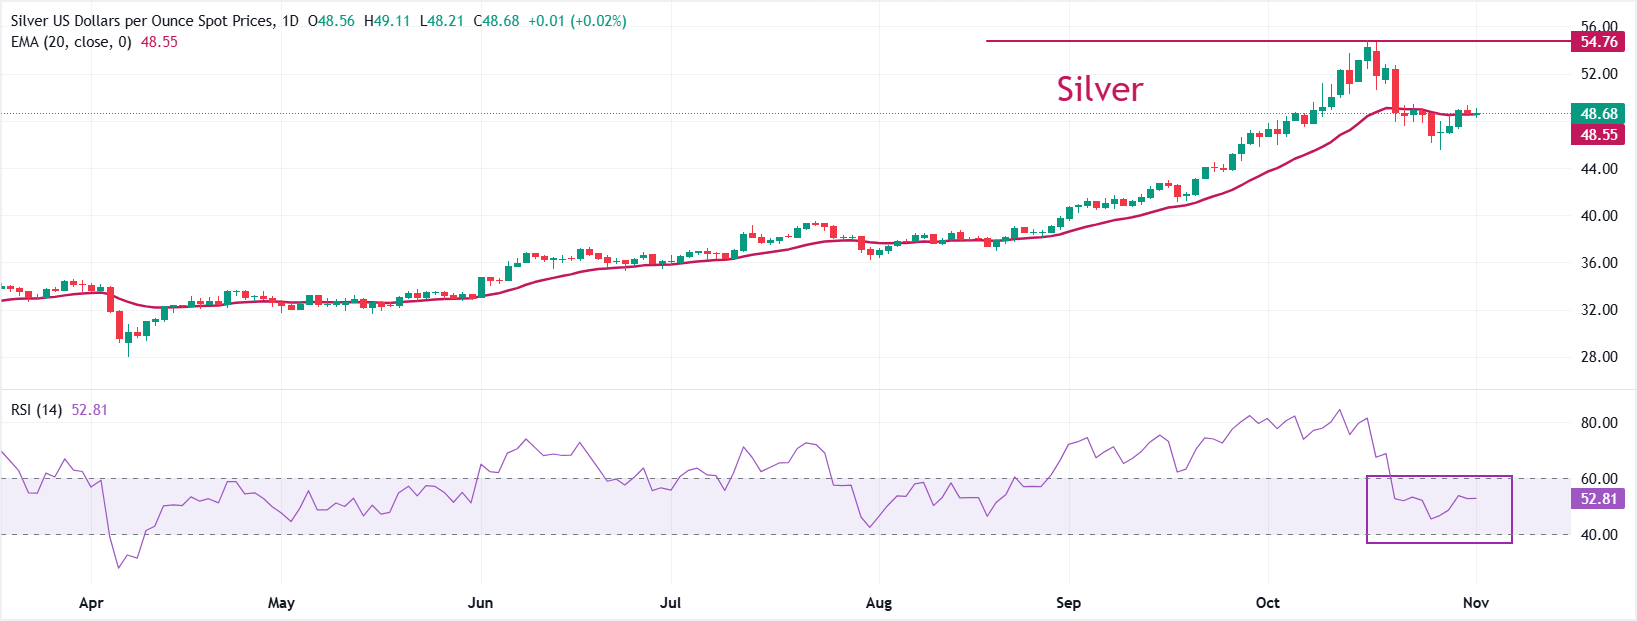
Silver price trades in a tight range around $49.00. The near-term trend of the precious metal appears to be sideways as the precious metal wobbles near the 20-day Exponential Moving Average (EMA), which trades around $48.70.
The 14-day Relative Strength Index (RSI) trades inside the 40.00-60.00 range, suggesting indecisiveness among investors.
Looking down, the September 23 high of $44.47 would remain a key support. On the upside, the all-time high of $54.50 might act as key barrier.
Silver daily chart
Silver FAQs
Silver is a precious metal highly traded among investors. It has been historically used as a store of value and a medium of exchange. Although less popular than Gold, traders may turn to Silver to diversify their investment portfolio, for its intrinsic value or as a potential hedge during high-inflation periods. Investors can buy physical Silver, in coins or in bars, or trade it through vehicles such as Exchange Traded Funds, which track its price on international markets.
Silver prices can move due to a wide range of factors. Geopolitical instability or fears of a deep recession can make Silver price escalate due to its safe-haven status, although to a lesser extent than Gold's. As a yieldless asset, Silver tends to rise with lower interest rates. Its moves also depend on how the US Dollar (USD) behaves as the asset is priced in dollars (XAG/USD). A strong Dollar tends to keep the price of Silver at bay, whereas a weaker Dollar is likely to propel prices up. Other factors such as investment demand, mining supply – Silver is much more abundant than Gold – and recycling rates can also affect prices.
Silver is widely used in industry, particularly in sectors such as electronics or solar energy, as it has one of the highest electric conductivity of all metals – more than Copper and Gold. A surge in demand can increase prices, while a decline tends to lower them. Dynamics in the US, Chinese and Indian economies can also contribute to price swings: for the US and particularly China, their big industrial sectors use Silver in various processes; in India, consumers’ demand for the precious metal for jewellery also plays a key role in setting prices.
Silver prices tend to follow Gold's moves. When Gold prices rise, Silver typically follows suit, as their status as safe-haven assets is similar. The Gold/Silver ratio, which shows the number of ounces of Silver needed to equal the value of one ounce of Gold, may help to determine the relative valuation between both metals. Some investors may consider a high ratio as an indicator that Silver is undervalued, or Gold is overvalued. On the contrary, a low ratio might suggest that Gold is undervalued relative to Silver.
Author

Sagar Dua
FXStreet
Sagar Dua is associated with the financial markets from his college days. Along with pursuing post-graduation in Commerce in 2014, he started his markets training with chart analysis.


