Silver Price Forecast: XAG/USD trades cautiously below $80 ahead of Warsh’s confirmation hearing
- Silver price declines to near $79.00 amid caution ahead of Kevin Warsh’s confirmation hearing.
- The white metal saw a massive sell-off after Warsh’s nomination on January 30.
- Iran agrees to sit down again with the US for peace talks.
Silver price (XAG/USD) trades almost 1% lower at around $79.00 during the European trading session on Tuesday. The white metal faces selling pressure ahead of the confirmation hearing of United States (US) President Donald Trump’s nominee, Kevin Warsh, for the Federal Reserve’s (Fed) next chairman.
Investors will pay close attention to Kevin Warsh’s comments in his confirmation hearing to get cues on whether Washington’s economic agenda will direct his decisions during his term or if he will focus on preserving the Fed’s independence.
US President Trump has repeatedly criticized the Fed, especially Chairman Jerome Powell, after his return to the White House, for not lowering interest rates aggressively.
Recalling the nomination of Kevin Warsh as the replacement of Fed’s Powell on January 30, the Silver price fell by over 30% after posting a fresh all-time high at around $121.60 a day before. The sell-off was driven by Warsh’s historic opposition to Quantitative Easing (QE) in the Fed’s balance sheet, in his previous work at the central bank, under Ben Barnarke’s chairmanship, and a preference for a strong US Dollar.
On the geopolitical front, reports claiming that Iran has agreed to return to the table with the US to resume peace talks seem to be failing to offer support for the Silver price. Since the onset of the US-Iran, the Silver price has reacted positively to expectations of a ceasefire, as lower oil prices, being one of the possible outcome, tend to anchor inflation expectations.
Signs of easing inflation projections discourage central banks from tightening monetary conditions, a scenario that improves the appeal of non-yielding assets, such as Silver.
Silver technical analysis
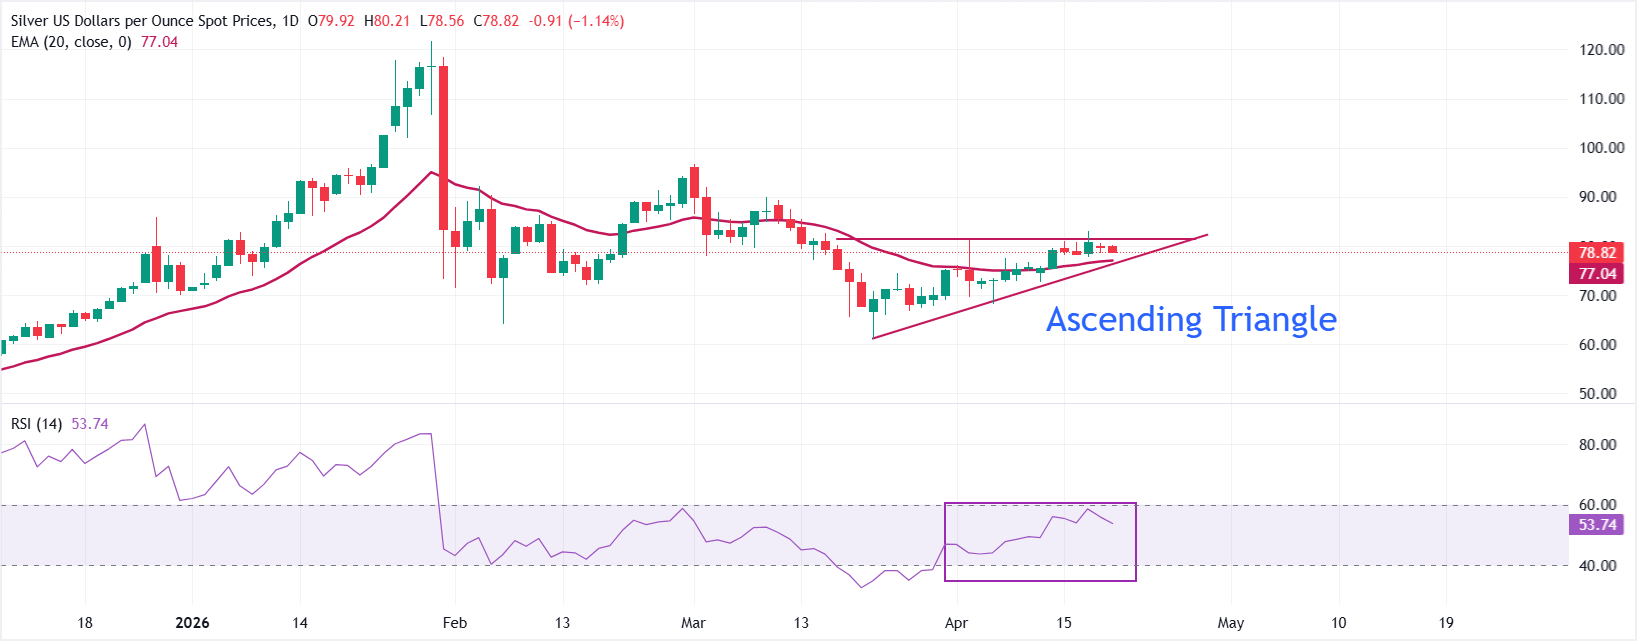
XAG/USD trades lower at around $79.00 as of writing. The price remains sticky near the 20-day Exponential Moving Average (EMA) at $77.04, indicating a sideways trend. The Ascending Triangle formation on the daily chart strengthens the case of a sharp volatility contraction.
The Relative Strength Index (RSI) at about 54 leans positive but not overbought, hinting at constructive momentum rather than a stretched advance.
On the topside, initial resistance is defined by the horizontal barrier of the triangle formation near $81.52, where a daily close above would open the door to a more convincing recovery phase toward the March 13 high of $85.46. On the downside, immediate attention stays on the advancing border of the above-mentioned chart pattern at around $76.50; a break below these levels would weaken the current constructive tone and expose a deeper pullback toward the psychological level of $70.00.
(The technical analysis of this story was written with the help of an AI tool.)
(The story was corrected at 08:00 GMT to say in the fourth paragraph that Recalling the nomination of Kevin Warsh as the replacement of Fed's Powell, and not Warch)
Silver FAQs
Silver is a precious metal highly traded among investors. It has been historically used as a store of value and a medium of exchange. Although less popular than Gold, traders may turn to Silver to diversify their investment portfolio, for its intrinsic value or as a potential hedge during high-inflation periods. Investors can buy physical Silver, in coins or in bars, or trade it through vehicles such as Exchange Traded Funds, which track its price on international markets.
Silver prices can move due to a wide range of factors. Geopolitical instability or fears of a deep recession can make Silver price escalate due to its safe-haven status, although to a lesser extent than Gold's. As a yieldless asset, Silver tends to rise with lower interest rates. Its moves also depend on how the US Dollar (USD) behaves as the asset is priced in dollars (XAG/USD). A strong Dollar tends to keep the price of Silver at bay, whereas a weaker Dollar is likely to propel prices up. Other factors such as investment demand, mining supply – Silver is much more abundant than Gold – and recycling rates can also affect prices.
Silver is widely used in industry, particularly in sectors such as electronics or solar energy, as it has one of the highest electric conductivity of all metals – more than Copper and Gold. A surge in demand can increase prices, while a decline tends to lower them. Dynamics in the US, Chinese and Indian economies can also contribute to price swings: for the US and particularly China, their big industrial sectors use Silver in various processes; in India, consumers’ demand for the precious metal for jewellery also plays a key role in setting prices.
Silver prices tend to follow Gold's moves. When Gold prices rise, Silver typically follows suit, as their status as safe-haven assets is similar. The Gold/Silver ratio, which shows the number of ounces of Silver needed to equal the value of one ounce of Gold, may help to determine the relative valuation between both metals. Some investors may consider a high ratio as an indicator that Silver is undervalued, or Gold is overvalued. On the contrary, a low ratio might suggest that Gold is undervalued relative to Silver.
Author

Sagar Dua
FXStreet
Sagar Dua is associated with the financial markets from his college days. Along with pursuing post-graduation in Commerce in 2014, he started his markets training with chart analysis.