Silver Price Forecast: XAG/USD slides toward $28.00
- XAG/USD hovers near $28.00, pressured by bearish RSI and moving averages above current levels.
- Breaking below $28.00 opens the door for further declines toward $27.71, potentially targeting the 200-DMA at $26.59.
- Bulls must reclaim the 100-DMA at $29.14 to shift momentum and regain control over Silver prices.

Silver price ended Tuesday’s session with losses of more than 1.50%, after economic data in the US hints that manufacturing activity continues to decelerate. Although it justifies the Federal Reserve’s first interest rate cut in September, the Greenback advanced sharply on relief that the labor market is cooling gradually. The XAG/USD trades at $28.05.
XAG/USD Price Forecast: Technical outlook
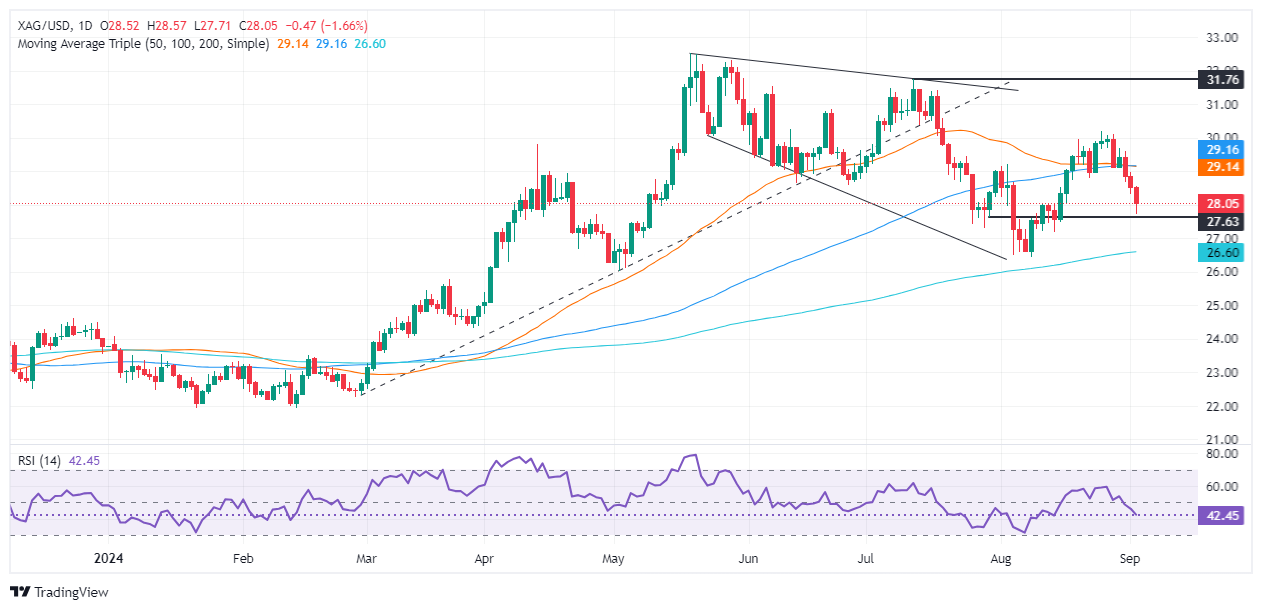
At the time of writing, XAG/USD hovers around the $28.00 mark after hitting a two-week low of $27.71, yet buyers recovered some ground. However, momentum is tilted bearish, as shown by the Relative Strength Index (RSI) and the 50 and 100-daily moving averages (DMAs) standing above the current Silver price.
For a bearish resumption, XAG/USD must clear the $28.00 figure, followed by the September 3 low of $27.71. Further weakness will sponsor a leg-down toward the August 14 swing low of $27.18, followed by the 200-day moving average (DMA) at $26.59.
Conversely, buyers need to reclaim the 100-DMA at $29.14 if they would like to regain control.
XAG/USD Price Action – Daily Chart
Silver FAQs
Silver is a precious metal highly traded among investors. It has been historically used as a store of value and a medium of exchange. Although less popular than Gold, traders may turn to Silver to diversify their investment portfolio, for its intrinsic value or as a potential hedge during high-inflation periods. Investors can buy physical Silver, in coins or in bars, or trade it through vehicles such as Exchange Traded Funds, which track its price on international markets.
Silver prices can move due to a wide range of factors. Geopolitical instability or fears of a deep recession can make Silver price escalate due to its safe-haven status, although to a lesser extent than Gold's. As a yieldless asset, Silver tends to rise with lower interest rates. Its moves also depend on how the US Dollar (USD) behaves as the asset is priced in dollars (XAG/USD). A strong Dollar tends to keep the price of Silver at bay, whereas a weaker Dollar is likely to propel prices up. Other factors such as investment demand, mining supply – Silver is much more abundant than Gold – and recycling rates can also affect prices.
Silver is widely used in industry, particularly in sectors such as electronics or solar energy, as it has one of the highest electric conductivity of all metals – more than Copper and Gold. A surge in demand can increase prices, while a decline tends to lower them. Dynamics in the US, Chinese and Indian economies can also contribute to price swings: for the US and particularly China, their big industrial sectors use Silver in various processes; in India, consumers’ demand for the precious metal for jewellery also plays a key role in setting prices.
Silver prices tend to follow Gold's moves. When Gold prices rise, Silver typically follows suit, as their status as safe-haven assets is similar. The Gold/Silver ratio, which shows the number of ounces of Silver needed to equal the value of one ounce of Gold, may help to determine the relative valuation between both metals. Some investors may consider a high ratio as an indicator that Silver is undervalued, or Gold is overvalued. On the contrary, a low ratio might suggest that Gold is undervalued relative to Silver.
Author

Christian Borjon Valencia
FXStreet
Markets analyst, news editor, and trading instructor with over 14 years of experience across FX, commodities, US equity indices, and global macro markets.


