Silver Price Forecast: XAG/USD rises to near $78.50 as oil price corrects
- Silver price jumps to near $78.50 as the oil price retraces after the US-Iran ceasefire extension.
- Washington to hold attacks against Iran until it receives a unified proposal.
- US President Trump's nominee Warsh expresses preference for a smaller balance sheet.
Silver price (XAG/USD) trades 2.3% higher to near $78.50 during the early European trade on Wednesday. The white metal strengthens as oil prices have corrected, following United States (US) President Donald Trump’s announcement of a ceasefire extension with Iran before the expiration of the two-week ceasefire on April 22.
WTI Oil price trades 2.3% lower at around $87.60, as of writing, after a significant jump to near $91.60 on Tuesday.
Since the start of the war between the US and Iran, the relationship between the Silver price and the oil price has remained inverse, as rising energy prices led to a sharp increase in inflation expectations globally. This scenario discourages central banks from slashing interest rates, which is unfavorable for non-yielding assets, such as Silver.
Late Tuesday, US President Trump announced, through a post on Truth.Social, the military department will hold attacks on Iran until Washington receives a unified proposal from Tehran. However, Trump clarified that the US blockade of Iranian sea ports would remain intact.
In the US, Kevin Warsh, a contender nominated by US President Trump for the new Federal Reserve (Fed) chairman, expressed the need to bring fundamental policy reforms, in his testimony before the Senate Banking Committee, and a preference for a smaller balance sheet.
Meanwhile, a slight downtick in the US Dollar (USD) due to the US-Iran ceasefire extension is also supporting the Silver price. Technically, a lower US Dollar makes the Silver price a favorable risk-reward bet for investors.
At the press time, the US Dollar Index (DXY), which gauges the Greenback’s value against six major currencies, trades 0.13% lower to near 98.27.
Silver technical analysis
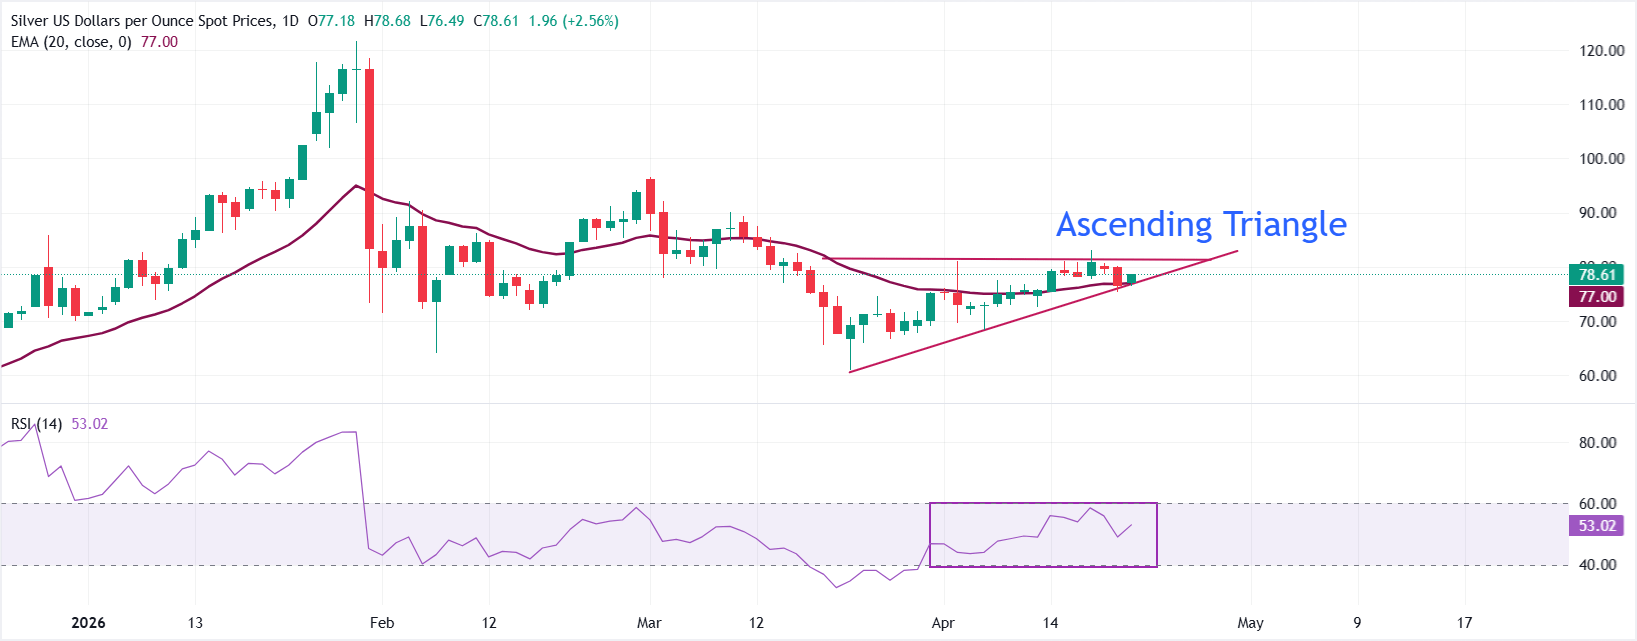
XAG/USD trades higher at around $78.50 as of writing. The metal reflects a neutral near-term bias amid an Ascending Triangle chart formation on a daily timeframe. The pair wobbles around the 20-period Exponential Moving Average (EMA), which is at $77.00, for over a month, reflecting a sideways trend.
The Relative Strength Index (RSI) remains inside the 40.00-60.00 zone, demonstrating indecisiveness among market participants.
On the topside, initial resistance is defined by the horizontal resistance of the above-mentioned chart pattern around $81.33, where a clear break would open the way to a stronger bullish extension toward the March 12 high of $87.45.
Looking down, immediate support is seen at the rising trend line around $78.34, with the 20-period EMA at $77.00 providing an additional dynamic floor. A daily close below $77 would weaken the current bullish bias and expose deeper retracements, where the psychological level of $70 will be the key support zone.
(The technical analysis of this story was written with the help of an AI tool.)
(This story was corrected on April 22 at 07:51 GMT to say in the third bullet that Kevin Warsh is the Fed Chair designate, not the Fed Chair.)
Silver FAQs
Silver is a precious metal highly traded among investors. It has been historically used as a store of value and a medium of exchange. Although less popular than Gold, traders may turn to Silver to diversify their investment portfolio, for its intrinsic value or as a potential hedge during high-inflation periods. Investors can buy physical Silver, in coins or in bars, or trade it through vehicles such as Exchange Traded Funds, which track its price on international markets.
Silver prices can move due to a wide range of factors. Geopolitical instability or fears of a deep recession can make Silver price escalate due to its safe-haven status, although to a lesser extent than Gold's. As a yieldless asset, Silver tends to rise with lower interest rates. Its moves also depend on how the US Dollar (USD) behaves as the asset is priced in dollars (XAG/USD). A strong Dollar tends to keep the price of Silver at bay, whereas a weaker Dollar is likely to propel prices up. Other factors such as investment demand, mining supply – Silver is much more abundant than Gold – and recycling rates can also affect prices.
Silver is widely used in industry, particularly in sectors such as electronics or solar energy, as it has one of the highest electric conductivity of all metals – more than Copper and Gold. A surge in demand can increase prices, while a decline tends to lower them. Dynamics in the US, Chinese and Indian economies can also contribute to price swings: for the US and particularly China, their big industrial sectors use Silver in various processes; in India, consumers’ demand for the precious metal for jewellery also plays a key role in setting prices.
Silver prices tend to follow Gold's moves. When Gold prices rise, Silver typically follows suit, as their status as safe-haven assets is similar. The Gold/Silver ratio, which shows the number of ounces of Silver needed to equal the value of one ounce of Gold, may help to determine the relative valuation between both metals. Some investors may consider a high ratio as an indicator that Silver is undervalued, or Gold is overvalued. On the contrary, a low ratio might suggest that Gold is undervalued relative to Silver.
Author

Sagar Dua
FXStreet
Sagar Dua is associated with the financial markets from his college days. Along with pursuing post-graduation in Commerce in 2014, he started his markets training with chart analysis.


