Silver Price Forecast: XAG/USD rises to near $64 on hopes that US-Iran ceasefire remains intact
- Silver price turns positive to near $64.00 on hopes that the US-Iran ceasefire is on.
- US President Trump confirmed that the latest missile operations were only in response to the helicopter downing.
- The Fed is expected to hike interest rates this year.

Silver price (XAG/USD) claws back its early losses and rises to near $64.10 during the early European trading session on Thursday. The white metal attracts bids amid hopes that the April ceasefire between the United States (US) and Iran remains intact despite the exchange of attacks this week.
US President Trump has told aides to deliver a message to Iran via Qatar that the attacks did not mean a “restart of all-out war,” and were only in response to the helicopter downing, The Wall Street Journal (WSJ) reported.
In the last two days, the US Central Command (CENTCOM) launched attacks on various targets in Iran, calling them “self-defense attacks” against Tehran’s “unwarranted and continued aggression”. These were anticipated as US President Donald Trump vowed retaliation against Iran for shooting down a US Apache helicopter patrolling over the Strait of Hormuz.
However, intensified speculation that the monetary policy adjustment by the Federal Reserve (Fed) this year will be on the upside is expected to keep the Silver price under pressure. According to the CME FedWatch tool, the odds of the Fed delivering at least one interest rate hike this year are almost 71%. Higher interest rates by the Fed bode poorly for non-yielding assets, such as Silver.
Silver technical analysis
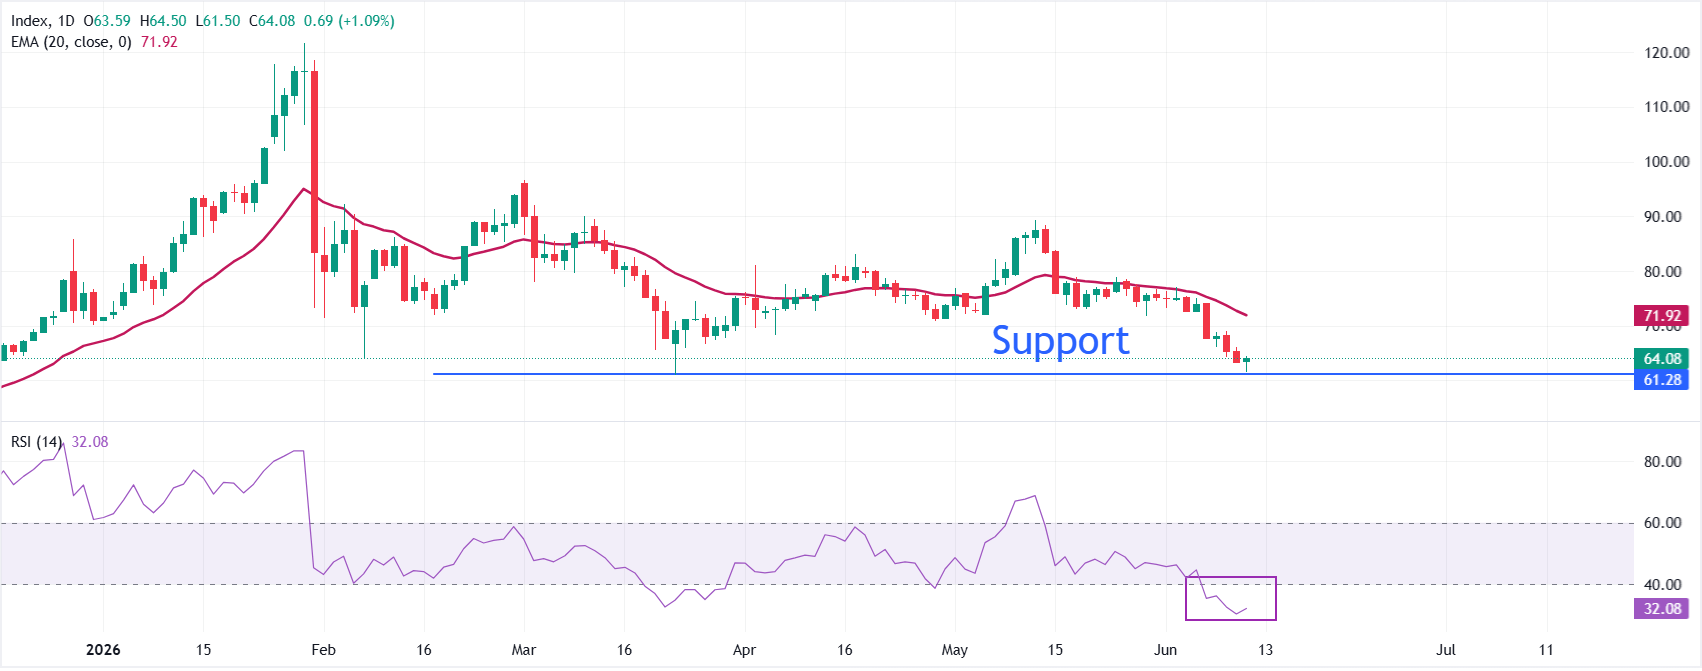
XAG/USD trades slightly higher at around $64.10 at press time. However, the index maintains a bearish near-term tone as price holds well beneath the 20-day Exponential Moving Average (EMA), which is at $71.92.
The distance to this EMA suggests the recent slide remains dominant, while the Relative Strength Index (RSI) at 32 is hovering just above oversold territory, hinting that downside momentum persists but may be losing some intensity.
On the topside, initial resistance is located at the 20-day EMA at $71.92, and only a sustained recovery above this dynamic barrier would start to ease the current bearish pressure. On the downside, the index could slide to $60 if it falls below the March 23 low of $61.01. The next major support zone would be the October 16 high at $54.86.
(The technical analysis of this story was written with the help of an AI tool.)
Silver FAQs
Silver is a precious metal highly traded among investors. It has been historically used as a store of value and a medium of exchange. Although less popular than Gold, traders may turn to Silver to diversify their investment portfolio, for its intrinsic value or as a potential hedge during high-inflation periods. Investors can buy physical Silver, in coins or in bars, or trade it through vehicles such as Exchange Traded Funds, which track its price on international markets.
Silver prices can move due to a wide range of factors. Geopolitical instability or fears of a deep recession can make Silver price escalate due to its safe-haven status, although to a lesser extent than Gold's. As a yieldless asset, Silver tends to rise with lower interest rates. Its moves also depend on how the US Dollar (USD) behaves as the asset is priced in dollars (XAG/USD). A strong Dollar tends to keep the price of Silver at bay, whereas a weaker Dollar is likely to propel prices up. Other factors such as investment demand, mining supply – Silver is much more abundant than Gold – and recycling rates can also affect prices.
Silver is widely used in industry, particularly in sectors such as electronics or solar energy, as it has one of the highest electric conductivity of all metals – more than Copper and Gold. A surge in demand can increase prices, while a decline tends to lower them. Dynamics in the US, Chinese and Indian economies can also contribute to price swings: for the US and particularly China, their big industrial sectors use Silver in various processes; in India, consumers’ demand for the precious metal for jewellery also plays a key role in setting prices.
Silver prices tend to follow Gold's moves. When Gold prices rise, Silver typically follows suit, as their status as safe-haven assets is similar. The Gold/Silver ratio, which shows the number of ounces of Silver needed to equal the value of one ounce of Gold, may help to determine the relative valuation between both metals. Some investors may consider a high ratio as an indicator that Silver is undervalued, or Gold is overvalued. On the contrary, a low ratio might suggest that Gold is undervalued relative to Silver.
Author

Sagar Dua
FXStreet
Sagar Dua is associated with the financial markets from his college days. Along with pursuing post-graduation in Commerce in 2014, he started his markets training with chart analysis.


