Silver Price Forecast: XAG/USD remains capped below 100-day SMA, downside risks persist
- Silver gains as US Treasury yields ease, but upside remains capped by a stronger US Dollar.
- Markets reassess Fed outlook, shifting from rate cuts to a prolonged hold through 2026.
- XAG/USD technical bias stays weak below the 100-day SMA.

Silver (XAG/USD) trades on the front foot on Monday, supported by a pullback in US Treasury yields as traders reassess the Federal Reserve’s (Fed) monetary policy path. At the time of writing, XAG/USD is trading around $70.50, up nearly 1% on the day. However, a broadly stronger US Dollar (USD) is limiting follow-through buying.
US Treasury yields are pulling back after a recent surge to multi-month highs, with the benchmark 10-year yield down more than 6 basis points (bps) to around 4.35% on Monday. Earlier, markets had priced in at least two rate cuts before the US-Iran war, but rising Oil prices briefly lifted expectations of rate hikes toward year-end.
Those bets are now being scaled back, with traders increasingly expecting the Fed to hold rates steady through 2026, according to the CME FedWatch Tool.
This shift reflects growing concerns that higher interest rates, combined with elevated energy prices, could weigh on economic growth, reducing the need for tightening.
That said, despite the recent stabilization, Silver is likely to remain volatile as shifting rate expectations and ongoing Middle East tensions continue to drive market sentiment.
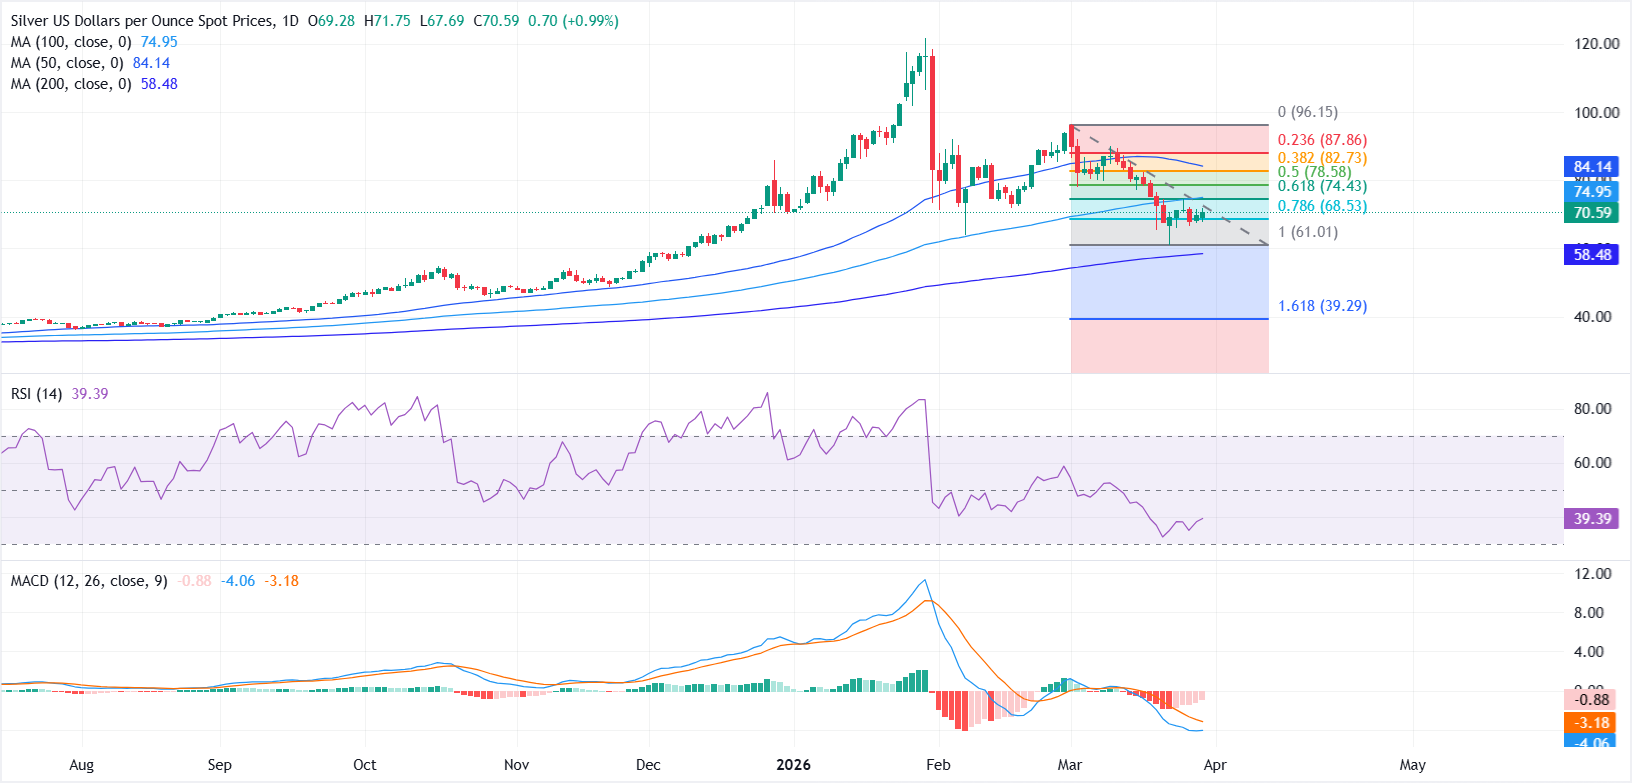
From a technical perspective, the near-term outlook for XAG/USD is neutral to bearish, as prices remain capped below the 100-day Simple Moving Average (SMA) at $74.96 after slipping below it earlier this month.
The Relative Strength Index (RSI) hovers near 40, indicating weak momentum and keeping downside pressure intact without signaling oversold conditions. The Moving Average Convergence Divergence (MACD) indicator remains below zero, though the line edges higher toward the signal line, which hints at fading bearish momentum rather than a confirmed shift higher.
Immediate resistance emerges at the 61.8% Fibonacci retracement at $74.43, measured from the $61.01 low to the $96.15 high, with the 50% retracement at $78.58 as the next hurdle if a bounce extends.
On the downside, initial support is seen near the recent lows around $68, which converges with the 78.6% retracement at $68.53, forming a key defensive area for buyers.
A decisive break below this zone would expose the psychological $65 handle and bring the 200-day SMA near $58 into focus, while recovery above $74.43 would ease immediate bearish pressure and open the way toward $78.58.
Inflation FAQs
Inflation measures the rise in the price of a representative basket of goods and services. Headline inflation is usually expressed as a percentage change on a month-on-month (MoM) and year-on-year (YoY) basis. Core inflation excludes more volatile elements such as food and fuel which can fluctuate because of geopolitical and seasonal factors. Core inflation is the figure economists focus on and is the level targeted by central banks, which are mandated to keep inflation at a manageable level, usually around 2%.
The Consumer Price Index (CPI) measures the change in prices of a basket of goods and services over a period of time. It is usually expressed as a percentage change on a month-on-month (MoM) and year-on-year (YoY) basis. Core CPI is the figure targeted by central banks as it excludes volatile food and fuel inputs. When Core CPI rises above 2% it usually results in higher interest rates and vice versa when it falls below 2%. Since higher interest rates are positive for a currency, higher inflation usually results in a stronger currency. The opposite is true when inflation falls.
Although it may seem counter-intuitive, high inflation in a country pushes up the value of its currency and vice versa for lower inflation. This is because the central bank will normally raise interest rates to combat the higher inflation, which attract more global capital inflows from investors looking for a lucrative place to park their money.
Formerly, Gold was the asset investors turned to in times of high inflation because it preserved its value, and whilst investors will often still buy Gold for its safe-haven properties in times of extreme market turmoil, this is not the case most of the time. This is because when inflation is high, central banks will put up interest rates to combat it. Higher interest rates are negative for Gold because they increase the opportunity-cost of holding Gold vis-a-vis an interest-bearing asset or placing the money in a cash deposit account. On the flipside, lower inflation tends to be positive for Gold as it brings interest rates down, making the bright metal a more viable investment alternative.
Author

Vishal Chaturvedi
FXStreet
I am a macro-focused research analyst with over four years of experience covering forex and commodities market. I enjoy breaking down complex economic trends and turning them into clear, actionable insights that help traders stay ahead of the curve.