Silver Price Forecast: XAG/USD jumps to near $34 as Trump’s tariffs stoke global uncertainty
- Silver price gains as auto tariffs by US President Trump have improved its safe-haven demand.
- Trump’s auto tariffs will also be unfavorable for the US economy.
- Investors await the US PCE inflation data, which will be released on Friday.

Silver price (XAG/USD) advances to near $34.00 during European trading hours on Thursday. The white metal strengthens as fresh 25% tariffs on cars entering the United States (US) have stoked fears of global economic uncertainty.
US President Donald Trump said on Wednesday that auto tariffs “will be 25%”, which will come into effect April 2 and will be collected from April 3. Trump added that these tariffs would be permanent.
The impact of Trump’s auto tariffs will be significant on Mexico, Canada, Japan, South Korea, and Germany, which were the top 5 auto exporters to the United States in 2022, according to the Commerce Department.
The Silver price tends to perform better in heightening global economic uncertainty.
US President Trump’s auto tariffs have also weighed on the US Dollar (USD) as its consequences will also be borne by the domestic economy. The automakers of the US would be forced to set up manufacturing facilities in the domestic region. Given high labor cost in the US economy, prices of cars will shoot up, which will diminish the purchasing power of households. The US Dollar Index (DXY), which tracks the Greenback’s value against six major currencies, retraces from its three-week high of 104.68 posted on Wednesday.
Going forward, investors will focus on the US Personal Consumption Expenditure Price Index (PCE) data for February, which will be released on Friday. Economists expect the US core PCE inflation, which is the Federal Reserve’s (Fed) preferred inflation gauge, to have grown at a faster pace of 2.7% year-on-year, compared to the 2.6% increase seen in January.
Silver technical analysis
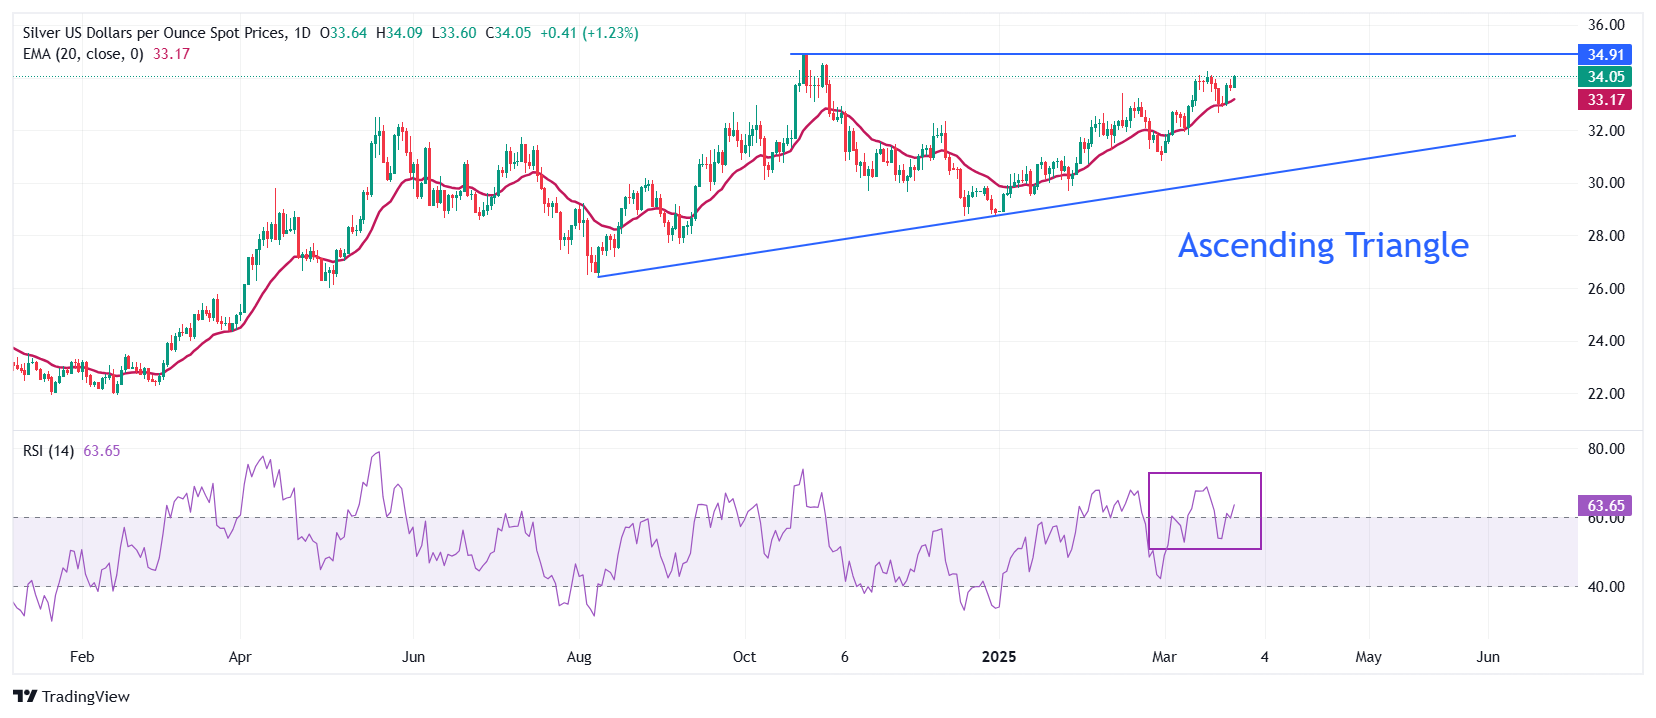
Silver price advances toward the flat border of the Ascending Triangle chart pattern formation on the daily timeframe near the October 22 high of $34.87. The upward-sloping border of the above-mentioned chart pattern is placed from the August 8 low of $26.45. Technically, the Ascending Triangle pattern indicates indecisiveness among market participants.
The 20-day Exponential Moving Average (EMA) near $33.20 continues to provide support to the Silver price.
The 14-day Relative Strength Index (RSI) rebounds above 60.00, suggesting a resurgence in bullish momentum.
Looking down, the March 6 high of $32.77 will act as key support for the Silver price. While, the October 22 high of $34.87 will be the major barrier.
Silver daily chart
Silver FAQs
Silver is a precious metal highly traded among investors. It has been historically used as a store of value and a medium of exchange. Although less popular than Gold, traders may turn to Silver to diversify their investment portfolio, for its intrinsic value or as a potential hedge during high-inflation periods. Investors can buy physical Silver, in coins or in bars, or trade it through vehicles such as Exchange Traded Funds, which track its price on international markets.
Silver prices can move due to a wide range of factors. Geopolitical instability or fears of a deep recession can make Silver price escalate due to its safe-haven status, although to a lesser extent than Gold's. As a yieldless asset, Silver tends to rise with lower interest rates. Its moves also depend on how the US Dollar (USD) behaves as the asset is priced in dollars (XAG/USD). A strong Dollar tends to keep the price of Silver at bay, whereas a weaker Dollar is likely to propel prices up. Other factors such as investment demand, mining supply – Silver is much more abundant than Gold – and recycling rates can also affect prices.
Silver is widely used in industry, particularly in sectors such as electronics or solar energy, as it has one of the highest electric conductivity of all metals – more than Copper and Gold. A surge in demand can increase prices, while a decline tends to lower them. Dynamics in the US, Chinese and Indian economies can also contribute to price swings: for the US and particularly China, their big industrial sectors use Silver in various processes; in India, consumers’ demand for the precious metal for jewellery also plays a key role in setting prices.
Silver prices tend to follow Gold's moves. When Gold prices rise, Silver typically follows suit, as their status as safe-haven assets is similar. The Gold/Silver ratio, which shows the number of ounces of Silver needed to equal the value of one ounce of Gold, may help to determine the relative valuation between both metals. Some investors may consider a high ratio as an indicator that Silver is undervalued, or Gold is overvalued. On the contrary, a low ratio might suggest that Gold is undervalued relative to Silver.
BRANDED CONTENT
Finding a broker with low spreads can make a big difference in your trading success. Discover our top picks for low-spread brokers, each offering unique benefits to fit your strategy.
Author

Sagar Dua
FXStreet
Sagar Dua is associated with the financial markets from his college days. Along with pursuing post-graduation in Commerce in 2014, he started his markets training with chart analysis.


