Silver Price Forecast: XAG/USD consolidates gains above $36.00
- Silver correction has been contained above $36.00, the trend remains positive.
- The precious metal holds gains despite a less favourable context for safe havens.
- XAG/USD maintains its bullish trend intact with $37.00 resistance in focus.

Silver prices (XAG/USD) remain close to the multi-year highs near $37.00 hit last week, despite a moderate decline in demand for safe-haven assets, like precious metals, as fears that the Israel-Iran war might turn into a regional conflict have eased.
Israel and Iran have kept exchanging missile attacks over the weekend in a war that entered its fourth day, but the conflict did not extend to other countries in the area, at least for now. Apart from that, several countries have offered their efforts to mediate between the contenders, and US President Dolanld Trump is pushing them to sit and try to reach a peace deal. All this has translated into a slightly brighter market mood, which is weighing on demand for precious metals
XAG/USD bulls remain focused on the $37.00 resistance area
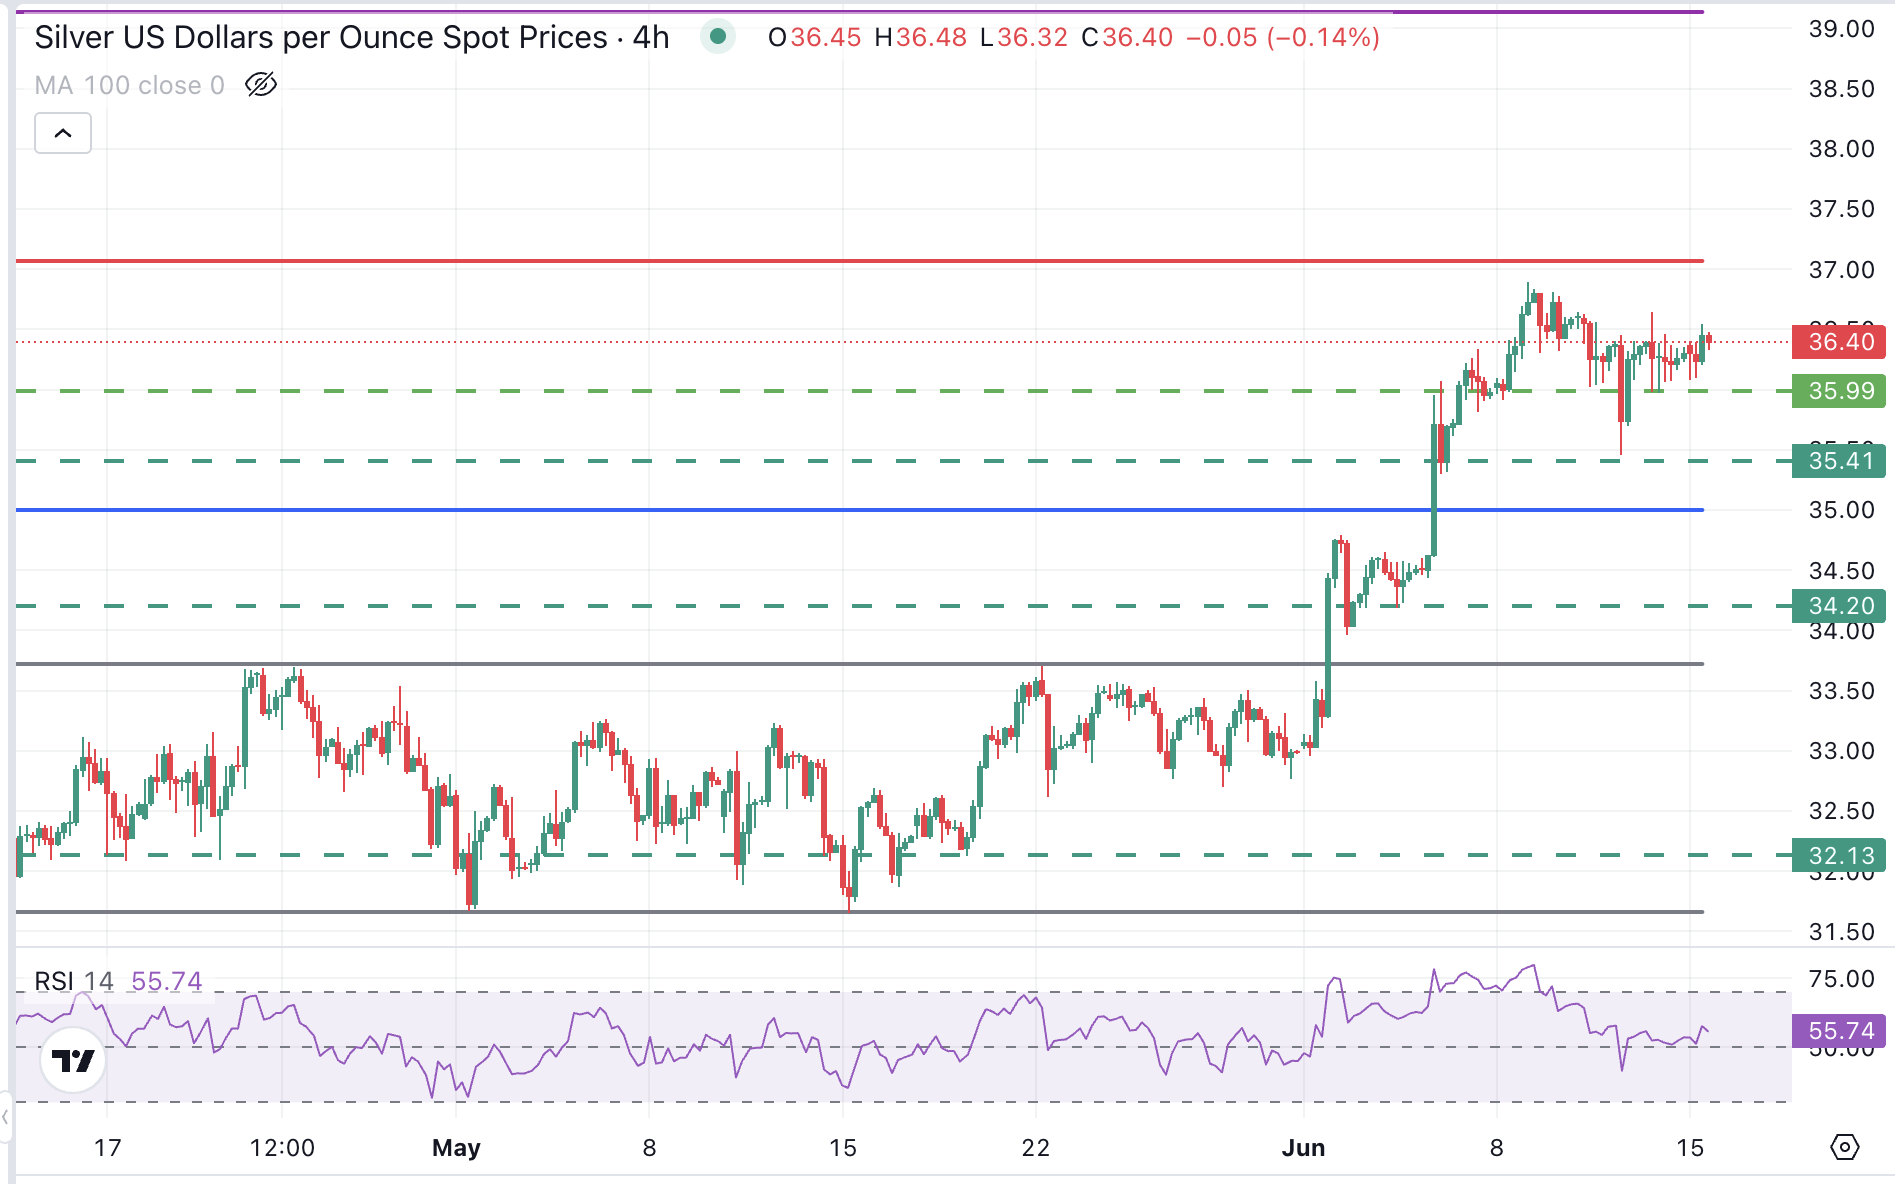
The technical picture remains bullish. The pair has been posting higher highs and higher lows since early June, and the correction from last week's highs has been contained at $35.50.
The doji candles on the daily chart reflect a hesitant market at current levels, but the 4-Hour RSI remains steady above 50, highlighting the bullish trend.
On the downside, immediate support is at the $36.00 level (June 11 and 13 lows) above $35.50 (June 12 low). A bearish reaction below here would put the bullish trend into question and bring the June 4 low, at $34.20, back into play.
On the upside, the $37.00 area is the 261.8% retracement of the April-May trade range, often a target for bullish and bearish cycles. So far, however, there is no clear sign of a trend shift. Above here, the next target is the 361.8% Fibonacci extension of the same trend, at $39.10.
XAG/USD 4-Hour Chart
Silver FAQs
Silver is a precious metal highly traded among investors. It has been historically used as a store of value and a medium of exchange. Although less popular than Gold, traders may turn to Silver to diversify their investment portfolio, for its intrinsic value or as a potential hedge during high-inflation periods. Investors can buy physical Silver, in coins or in bars, or trade it through vehicles such as Exchange Traded Funds, which track its price on international markets.
Silver prices can move due to a wide range of factors. Geopolitical instability or fears of a deep recession can make Silver price escalate due to its safe-haven status, although to a lesser extent than Gold's. As a yieldless asset, Silver tends to rise with lower interest rates. Its moves also depend on how the US Dollar (USD) behaves as the asset is priced in dollars (XAG/USD). A strong Dollar tends to keep the price of Silver at bay, whereas a weaker Dollar is likely to propel prices up. Other factors such as investment demand, mining supply – Silver is much more abundant than Gold – and recycling rates can also affect prices.
Silver is widely used in industry, particularly in sectors such as electronics or solar energy, as it has one of the highest electric conductivity of all metals – more than Copper and Gold. A surge in demand can increase prices, while a decline tends to lower them. Dynamics in the US, Chinese and Indian economies can also contribute to price swings: for the US and particularly China, their big industrial sectors use Silver in various processes; in India, consumers’ demand for the precious metal for jewellery also plays a key role in setting prices.
Silver prices tend to follow Gold's moves. When Gold prices rise, Silver typically follows suit, as their status as safe-haven assets is similar. The Gold/Silver ratio, which shows the number of ounces of Silver needed to equal the value of one ounce of Gold, may help to determine the relative valuation between both metals. Some investors may consider a high ratio as an indicator that Silver is undervalued, or Gold is overvalued. On the contrary, a low ratio might suggest that Gold is undervalued relative to Silver.
Author

Guillermo Alcala
FXStreet
Graduated in Communication Sciences at the Universidad del Pais Vasco and Universiteit van Amsterdam, Guillermo has been working as financial news editor and copywriter in diverse Forex-related firms, like FXStreet and Kantox.


