Silver Price Forecast: XAG/USD bounces from year-to-date lows ahead of Fed rate call
- Silver rebounds as Oil prices ease, while traders await the Fed’s interest rate decision.
- Lower highs and lower lows keep the bearish bias intact below the 100-day and 200-day SMAs.
- Daily RSI near 34 and a negative MACD suggest sellers retain the upper hand.

Silver (XAG/USD) rebounds on Tuesday after slipping to a fresh year-to-date low of $52.67 during Asian trading hours. The recovery comes as easing Oil prices offer some relief as diplomatic efforts continue to reduce tensions in the Middle East. At the time of writing, XAG/USD trades around $54.50, up 0.96% on the day.
However, a firmer US Dollar (USD) limits the metal’s gains ahead of the Federal Reserve’s (Fed) interest rate decision on Wednesday. The US Dollar Index (DXY), which tracks the Greenback’s value against a basket of six major currencies, trades around 102.23, near a two-week high.
Strategists at BNY Markets expect the Fed to remain on the sidelines at this week’s October FOMC meeting, broadly in line with current market pricing. “We don’t foresee a rate hike at the October FOMC tomorrow and prefer to place our expectations for further tightening on the December meeting,” they write, adding that, “based on Fed commentary and a steady, if sticky, inflation outlook, we don’t think the weight of the Committee will fall on the hawkish side.”
With a pause widely expected, traders will focus on the Fed’s policy statement and Chair Kevin Warsh’s remarks for clues on the timing of the next rate hike. Higher interest rates tend to weigh on non-yielding Silver by increasing the opportunity cost of holding it. A hawkish message could weigh on Silver, while a more cautious tone could give the metal room to extend its recovery.
Technical analysis
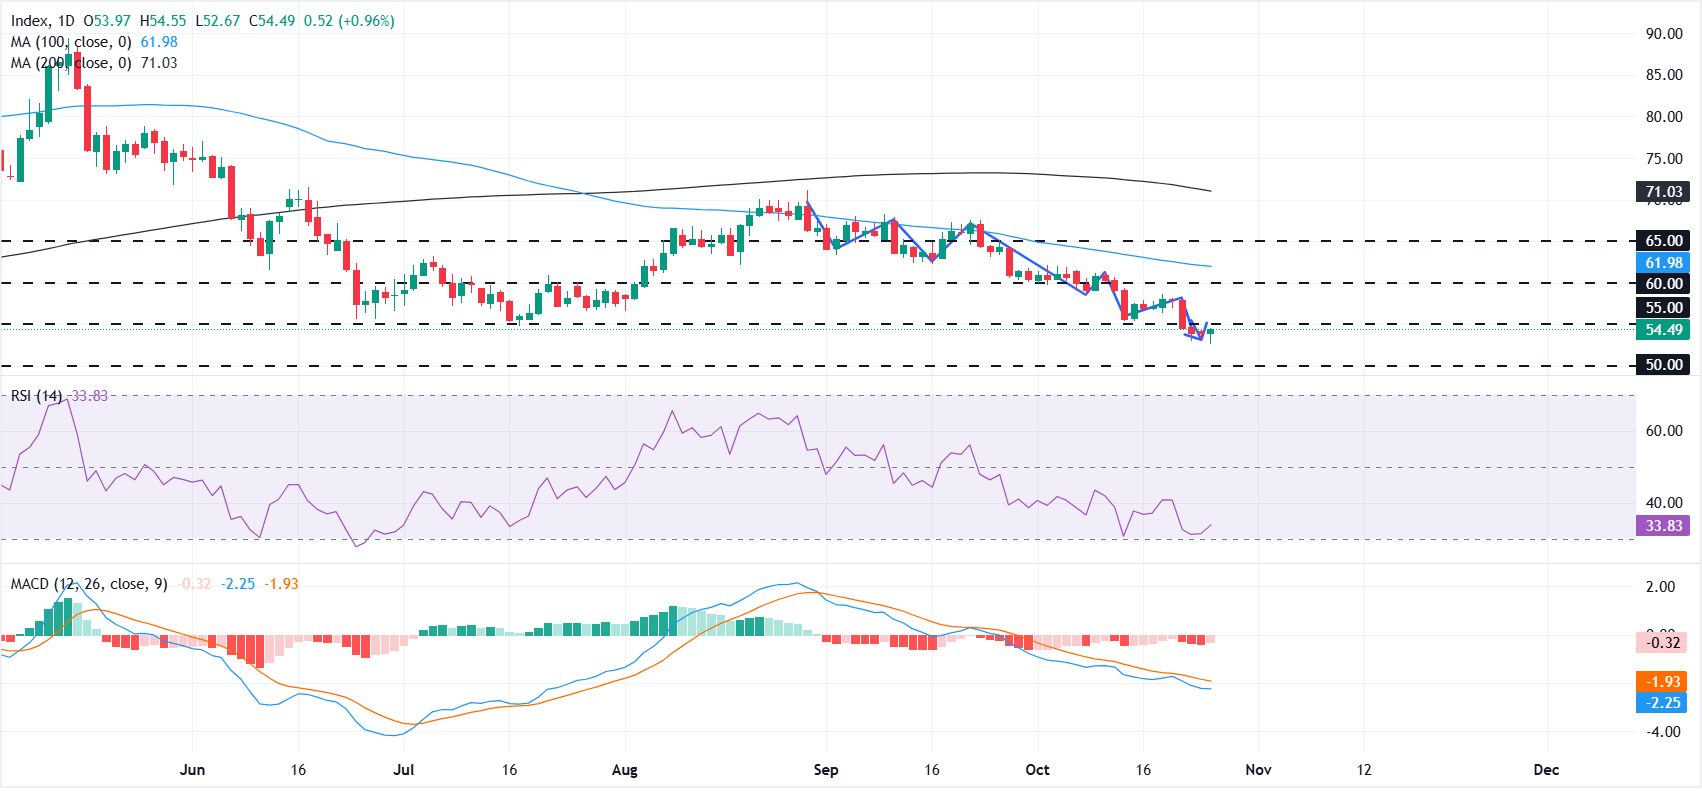
On the daily chart, XAG/USD continues to form lower highs and lower lows after briefly peaking above $70 in late August. The metal remains below the 100-day and 200-day Simple Moving Averages (SMAs), reinforcing a bearish near-term bias.
The Relative Strength Index (RSI) near 34 hints at lingering, but not extreme, oversold conditions. The Moving Average Convergence Divergence (MACD) indicator stays negative, with the line below zero and momentum subdued, which reinforces the risk of further corrective downside.
On the topside, initial resistance is seen at the nearby horizontal level of $55, followed by $60 and the 100-day SMA at $62, which form a dense recovery barrier if bulls attempt a rebound. Above there, the $65 horizontal line and the 200-day SMA at $71 mark subsequent resistance zones that would need to be reclaimed to shift the broader picture away from the current bearish tone.
On the downside, a break below Monday’s low of $52.67 would expose the $50.00 psychological support. A decisive break below that level could open the door to a deeper decline.
(The technical analysis of this story was written with the help of an AI tool. Know more.)
Silver FAQs
Silver is a precious metal highly traded among investors. It has been historically used as a store of value and a medium of exchange. Although less popular than Gold, traders may turn to Silver to diversify their investment portfolio, for its intrinsic value or as a potential hedge during high-inflation periods. Investors can buy physical Silver, in coins or in bars, or trade it through vehicles such as Exchange Traded Funds, which track its price on international markets.
Silver prices can move due to a wide range of factors. Geopolitical instability or fears of a deep recession can make Silver price escalate due to its safe-haven status, although to a lesser extent than Gold's. As a yieldless asset, Silver tends to rise with lower interest rates. Its moves also depend on how the US Dollar (USD) behaves as the asset is priced in dollars (XAG/USD). A strong Dollar tends to keep the price of Silver at bay, whereas a weaker Dollar is likely to propel prices up. Other factors such as investment demand, mining supply – Silver is much more abundant than Gold – and recycling rates can also affect prices.
Silver is widely used in industry, particularly in sectors such as electronics or solar energy, as it has one of the highest electric conductivity of all metals – more than Copper and Gold. A surge in demand can increase prices, while a decline tends to lower them. Dynamics in the US, Chinese and Indian economies can also contribute to price swings: for the US and particularly China, their big industrial sectors use Silver in various processes; in India, consumers’ demand for the precious metal for jewellery also plays a key role in setting prices.
Silver prices tend to follow Gold's moves. When Gold prices rise, Silver typically follows suit, as their status as safe-haven assets is similar. The Gold/Silver ratio, which shows the number of ounces of Silver needed to equal the value of one ounce of Gold, may help to determine the relative valuation between both metals. Some investors may consider a high ratio as an indicator that Silver is undervalued, or Gold is overvalued. On the contrary, a low ratio might suggest that Gold is undervalued relative to Silver.
Author

Vishal Chaturvedi
FXStreet
I am a macro-focused research analyst with over four years of experience covering forex and commodities market. I enjoy breaking down complex economic trends and turning them into clear, actionable insights that help traders stay ahead of the curve.