Silver Price Forecast: Bulls struggle below the 100-day SMA
- Silver turns lower on Tuesday as Fed rate-hike expectations weigh on demand.
- Traders await US PPI and CPI data for clues about next week’s Fed decision.
- RSI stays neutral near 53, with the metal holding above key Fibonacci support at $64.80.
Silver (XAG/USD) pulls back on Tuesday after failing to hold its earlier advance. At the time of writing, the metal trades around $66 after reaching an intraday high near $67.19. The retreat comes as rising Oil prices add to concerns that inflation could stay elevated and encourage central banks to keep borrowing costs high.
Higher interest rates tend to weigh on Silver because the metal offers no yield. Expectations of tighter Federal Reserve (Fed) policy have strengthened since Friday’s upbeat US employment report, with the CME FedWatch tool showing around a 60% chance of a 25-basis-point rate hike next week.
However, the downside in Silver appears limited as the US Dollar (USD) stays under pressure. The US Dollar Index (DXY), which tracks the Greenback’s value against a basket of six major currencies, trades around 98.82 after briefly reclaiming 99, hovering near its lowest level in more than two weeks.
Attention now turns to the US Producer Price Index (PPI) on Thursday and Consumer Price Index (CPI) on Friday. The figures will help determine whether the Fed raises interest rates at its September 15-16 meeting.
Technical Analysis
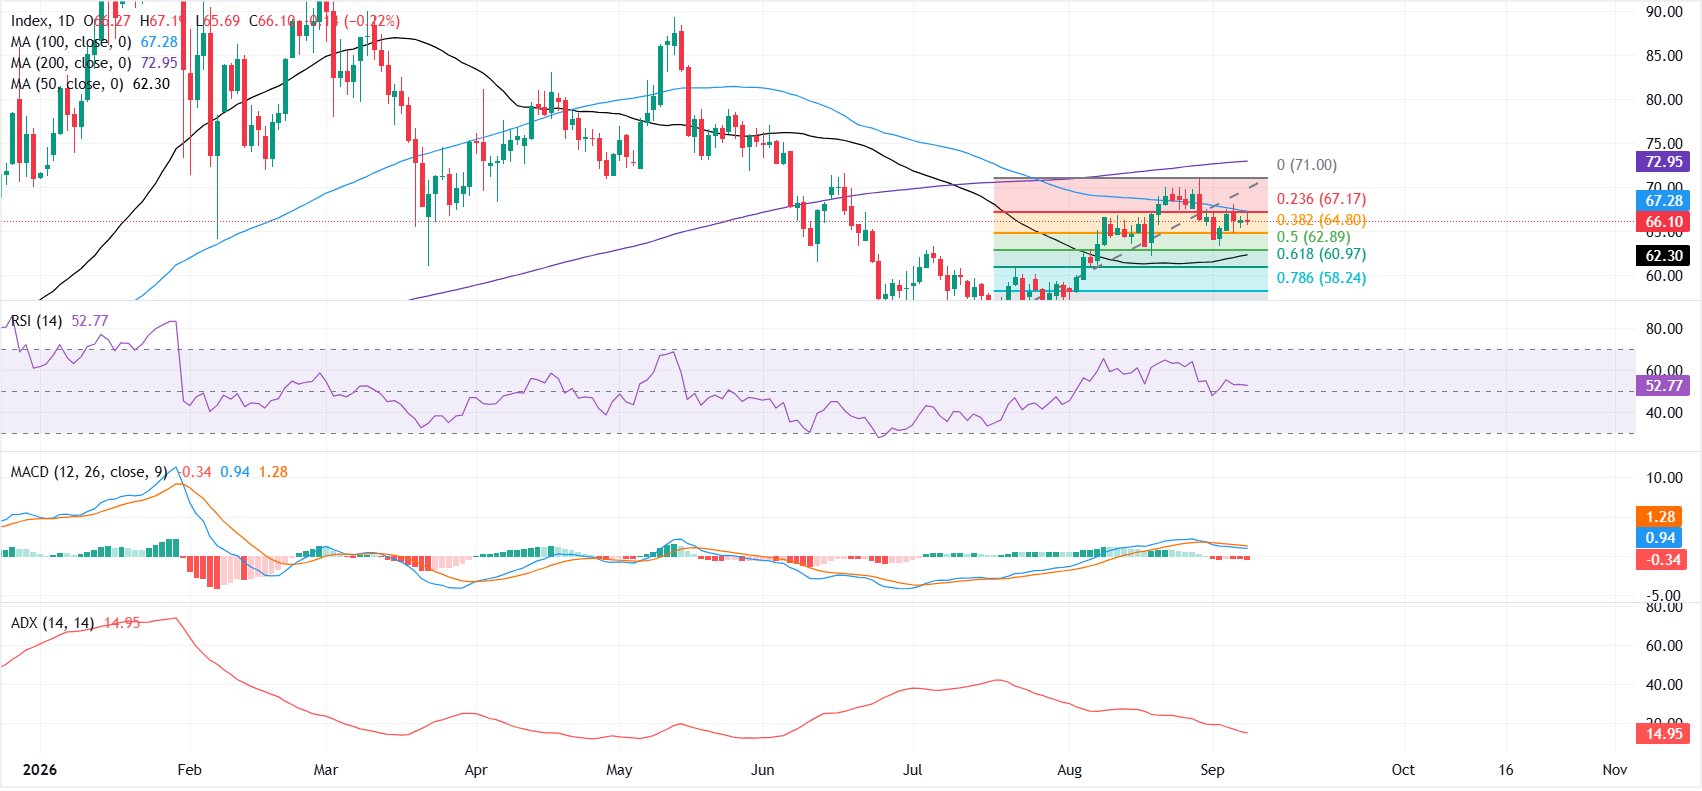
On the daily chart, XAG/USD holds above the 50-day simple moving average (SMA) at $62 and a dense Fibonacci support band clustered between the 61.8% retracement at $60.97 and the 38.2% level at $64.80, suggesting downside attempts remain cushioned for now.
However, price still trades below the 100-day SMA at $67.28 and the 23.6% Fibonacci retracement at $67.17, keeping the broader tone neutral, with the Relative Strength Index (RSI) around 53 and a slightly negative Moving Average Convergence Divergence (MACD) hinting at fading upside momentum.
On the topside, initial resistance is seen at the 23.6% Fibonacci retracement at $67.17, closely followed by the 100-day SMA at $67. A daily close above this confluence would open the way toward the next hurdle at the prior swing anchor near $71 and then the 200-day SMA at $72.
On the downside, immediate support comes from the 38.2% retracement at $64.80, with further cushions at the 50% level at $62.89 and the 61.8% retracement at $60.97. A break below this band would expose deeper Fibonacci support at $58.24 and $54.77, where the 50-day SMA at $62 currently underpins the broader consolidation.
(The technical analysis of this story was written with the help of an AI tool. Know more.)
Author

Vishal Chaturvedi
FXStreet
I am a macro-focused research analyst with over four years of experience covering forex and commodities market. I enjoy breaking down complex economic trends and turning them into clear, actionable insights that help traders stay ahead of the curve.

















