|

Silver Price Analysis: XAG/USD remains vulnerable, acceptance below $20.00 awaited

  • Silver enters a bearish consolidation phase and oscillates in a narrow range around the $20.00 mark.
  • The technical setup supports prospects for an extension of the recent well-established downtrend.
  • A slightly oversold RSI on the daily chart is holding back bearish traders from placing fresh bets.

Silver struggles to gain any meaningful traction and extends its sideways consolidative price move around the $20.00 psychological mark through the mid-European session on Thursday. The white metal, meanwhile, remains well within the striking distance of over a four-month low touched on Wednesday and seems vulnerable to prolonging its downward trajectory witnessed since early February.

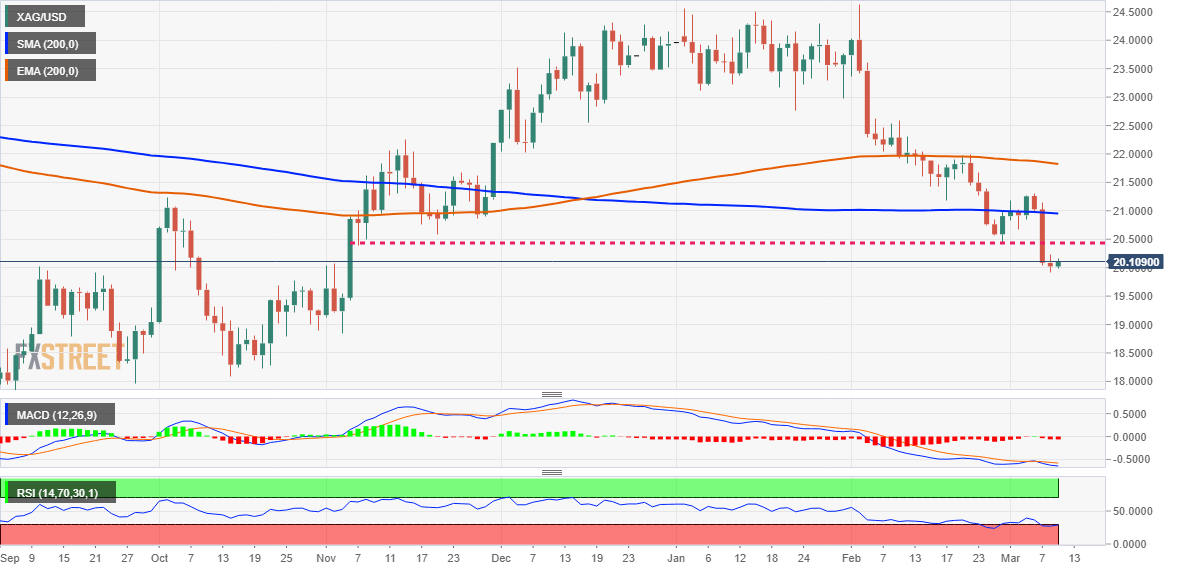
The recent breakdown through a technically significant 200-day Exponential Moving Average (EMA) was seen as a fresh trigger for bearish traders. Furthermore, this week's sustained weakness below the $20.50-$20.40 horizontal support, which coincided with the previous YTD low, adds credence to the negative outlook. This, in turn, suggests that the path of least resistance for the XAG/USD is to the downside.

That said, Relative Strength Index (RSI) on the daily chart is hovering in the oversold territory. Moreover, repeated failures to find acceptance below the $20.00 psychological mark make it prudent to wait for near-term consolidation before placing fresh bets around the XAG/USD. Nevertheless, the metal's inability to attract any buyers suggests that the near-term descending trend is still far from being over.

Hence, a subsequent slide towards testing the $19.60 intermediate support, en route to the $19.00 round-figure mark, looks like a distinct possibility. Some follow-through selling should pave the way for a slide towards the next relevant support near the $18.80-$18.75 region before the XAG/USD eventually drops to $18.30-$18.25 horizontal zone and the $18.00 level, which should offer strong support.

On the flip side, the $20.40-$20.50 support breakpoint now seems to act as an immediate barrier. Any further recovery is likely to attract fresh sellers and remains capped near the 200-day Simple Moving Average (SMA), currently pegged just ahead of the $21.00 mark. The latter should act as a pivotal point, which if cleared decisively could lift the XAG/USD to the mid-$21.00s. Bulls 
might then aim to reclaim the $22.00 mark.

Silver daily chart

fxsoriginal

Key levels to watch

XAG/USD

Overview
Today last price20.09
Today Daily Change0.07
Today Daily Change %0.35
Today daily open20.02
 
Trends
Daily SMA2021.29
Daily SMA5022.66
Daily SMA10022.17
Daily SMA20020.96
 
Levels
Previous Daily High20.23
Previous Daily Low19.92
Previous Weekly High21.27
Previous Weekly Low20.42
Previous Monthly High24.64
Previous Monthly Low20.42
Daily Fibonacci 38.2%20.04
Daily Fibonacci 61.8%20.11
Daily Pivot Point S119.88
Daily Pivot Point S219.74
Daily Pivot Point S319.57
Daily Pivot Point R120.2
Daily Pivot Point R220.37
Daily Pivot Point R320.51

Author

Haresh Menghani

Haresh Menghani is a detail-oriented professional with 10+ years of extensive experience in analysing the global financial markets.

More from Haresh Menghani
Share:

Markets move fast. We move first.

Orange Juice Newsletter brings you expert driven insights - not headlines. Every day on your inbox.

By subscribing you agree to our Terms and conditions.

Editor's Picks

EUR/USD edges above 1.1750 due to ECB-Fed policy divergence

EUR/USD has recovered its recent losses registered in the previous session, trading around 1.1760 during the Asian hours on Friday. Traders will likely observe Germany’s Manufacturing Purchasing Managers’ Index data later in the day.

GBP/USD gathers strength above 1.3450 on Fed rate cut bets, BoE's gradual policy path

The GBP/USD pair gathers strength to around 1.3480 during the early Asian session on Friday. Expectations of the US Federal Reserve rate cuts this year weigh on the US Dollar against the Pound Sterling. Philadelphia Fed President Anna Paulson is set to speak later on the weekend. 

Gold climbs to near $4,350 on Fed rate cut bets, geopolitical risks

Gold price rises to near $4,345 during the early Asian session on Friday. Gold finished 2025 with a significant rally, achieving an annual gain of around 65%, its biggest annual gain since 1979. The rally of the precious metal is bolstered by the prospect of further US interest rate cuts in 2026 and safe-haven flows.

Bitcoin, Ethereum and Ripple enter the New Year with breakout hopes

Bitcoin, Ethereum, and Ripple entered the new year trading at key technical levels on Friday, as traders seek fresh directional cues in January. With BTC locked in a tight range, ETH is approaching its 50-day Exponential Moving Average, while XRP is nearing resistance. A clear breakout across these top three cryptocurrencies could help define market momentum in the opening weeks of the year.

Economic outlook 2026-2027 in advanced countries: Solidity test

After a year marked by global economic resilience and ending on a note of optimism, 2026 looks promising and could be a year of solid economic performance. In our baseline scenario, we expect most of the supportive factors at work in 2025 to continue to play a role in 2026.

Crypto market outlook for 2026

Year 2025 was volatile, as crypto often is.  Among positive catalysts were favourable regulatory changes in the U.S., rise of Digital Asset Treasuries (DAT), adoption of AI and tokenization of Real-World-Assets (RWA).