|

Silver Price Analysis: XAG/USD plummets to two-week low, bears flirt with 50% Fibo.

  • Silver remains under heavy selling pressure for the fifth straight day on Tuesday.
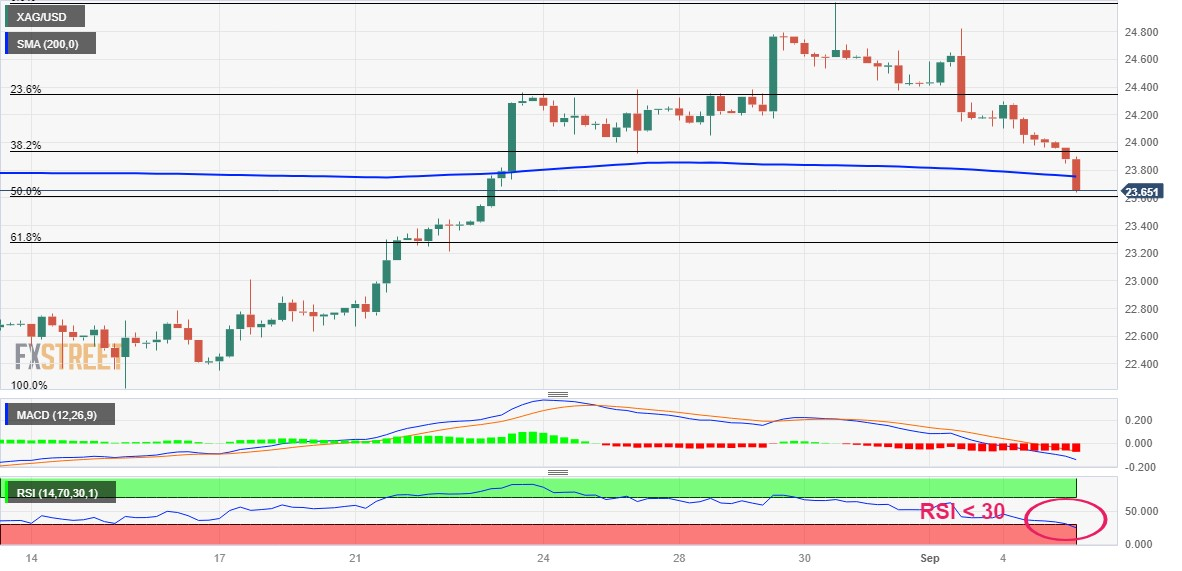
  • A sustained break below the 200-period SMA on the 4-hour chart favours bears.
  • The oversold RSI on hourly charts makes it prudent to wait for some consolidation.

Silver prolongs last week's rejection slide from the $25.00 psychological mark, or over a one-month peak and continues to lose ground for the fifth successive day on Tuesday. The downfall remains uninterrupted through the early European session and drags the white metal to a two-week low, around the $23.65 region in the last hour.

From a technical perspective, sustained break and acceptance below the $23.80-$23.75 area, representing the 200-period Simple Moving Average (SMA) on the 4-hour chart could be seen as a fresh trigger for bearish traders. Moreover, oscillators on the daily chart have just started gaining negative traction and support prospects for a further near-term depreciating move. That said, the Relative Strength Index (RSI) on hourly charts is flashing oversold conditions and might assist the XAG/USD to consolidate near current levels, representing the 50% Fibonacci retracement level of $22.25-$25.00 rally.

A convincing break below, however, will make silver vulnerable to accelerate the fall towards the 61.8% Fibo. level, around the $23.30-$23.25 region en route to the $23.00 round-figure mark. The downward trajectory could get extended further and drag the XAG/USD further below the $22.65-$22.60 area, towards challenging a strong horizontal support near the $22.20-$22.10 zone.

On the flip side, the 200-period SMA breakpoint, around the $23.75-$23.80 region, now seems to act as an immediate barrier ahead of the $24.00 round-figure mark. The latter represents the 38.2% Fibo. level, above which a bout of a short-covering move has the potential to lift the XAG/USD towards the 23.6% Fibo. level, around the $24.30-$24.35 area. Some follow-through buying might expose a four-month-old descending trend line resistance, currently near the $24.70-$24.75 zone. A sustained breakthrough, leading to a subsequent strength beyond the $25.00 mark, might shift the bias in favour of bullish traders.

Silver 4-hour chart

fxsoriginal

Technical levels to watch

XAG/USD

Overview
Today last price23.68
Today Daily Change-0.32
Today Daily Change %-1.33
Today daily open24
 
Trends
Daily SMA2023.47
Daily SMA5023.7
Daily SMA10023.92
Daily SMA20023.44
 
Levels
Previous Daily High24.3
Previous Daily Low23.96
Previous Weekly High25.02
Previous Weekly Low24.05
Previous Monthly High25.02
Previous Monthly Low22.23
Daily Fibonacci 38.2%24.09
Daily Fibonacci 61.8%24.17
Daily Pivot Point S123.88
Daily Pivot Point S223.76
Daily Pivot Point S323.55
Daily Pivot Point R124.21
Daily Pivot Point R224.42
Daily Pivot Point R324.54

Author

Haresh Menghani

Haresh Menghani is a detail-oriented professional with 10+ years of extensive experience in analysing the global financial markets.

More from Haresh Menghani
Share:

Markets move fast. We move first.

Orange Juice Newsletter brings you expert driven insights - not headlines. Every day on your inbox.

By subscribing you agree to our Terms and conditions.

Editor's Picks

EUR/USD edges above 1.1750 due to ECB-Fed policy divergence

EUR/USD has recovered its recent losses registered in the previous session, trading around 1.1760 during the Asian hours on Friday. Traders will likely observe Germany’s Manufacturing Purchasing Managers’ Index data later in the day.

GBP/USD gathers strength above 1.3450 on Fed rate cut bets, BoE's gradual policy path

The GBP/USD pair gathers strength to around 1.3480 during the early Asian session on Friday. Expectations of the US Federal Reserve rate cuts this year weigh on the US Dollar against the Pound Sterling. Philadelphia Fed President Anna Paulson is set to speak later on the weekend. 

Gold climbs to near $4,350 on Fed rate cut bets, geopolitical risks

Gold price rises to near $4,345 during the early Asian session on Friday. Gold finished 2025 with a significant rally, achieving an annual gain of around 65%, its biggest annual gain since 1979. The rally of the precious metal is bolstered by the prospect of further US interest rate cuts in 2026 and safe-haven flows.

Bitcoin, Ethereum and Ripple enter the New Year with breakout hopes

Bitcoin, Ethereum, and Ripple entered the new year trading at key technical levels on Friday, as traders seek fresh directional cues in January. With BTC locked in a tight range, ETH is approaching its 50-day Exponential Moving Average, while XRP is nearing resistance. A clear breakout across these top three cryptocurrencies could help define market momentum in the opening weeks of the year.

Economic outlook 2026-2027 in advanced countries: Solidity test

After a year marked by global economic resilience and ending on a note of optimism, 2026 looks promising and could be a year of solid economic performance. In our baseline scenario, we expect most of the supportive factors at work in 2025 to continue to play a role in 2026.

Crypto market outlook for 2026

Year 2025 was volatile, as crypto often is.  Among positive catalysts were favourable regulatory changes in the U.S., rise of Digital Asset Treasuries (DAT), adoption of AI and tokenization of Real-World-Assets (RWA).