Silver Price Analysis: XAG/USD challenges 200-period SMA/50% Fibo. confluence hurdle


  • Silver attracted some dip-buying on Thursday and turned positive for the second straight day.
  • The set-up seems tilted in favour of bullish traders and supports prospects for additional gains.
  • A sustained break below the $22.25-20 support is needed to negate the constructive outlook.

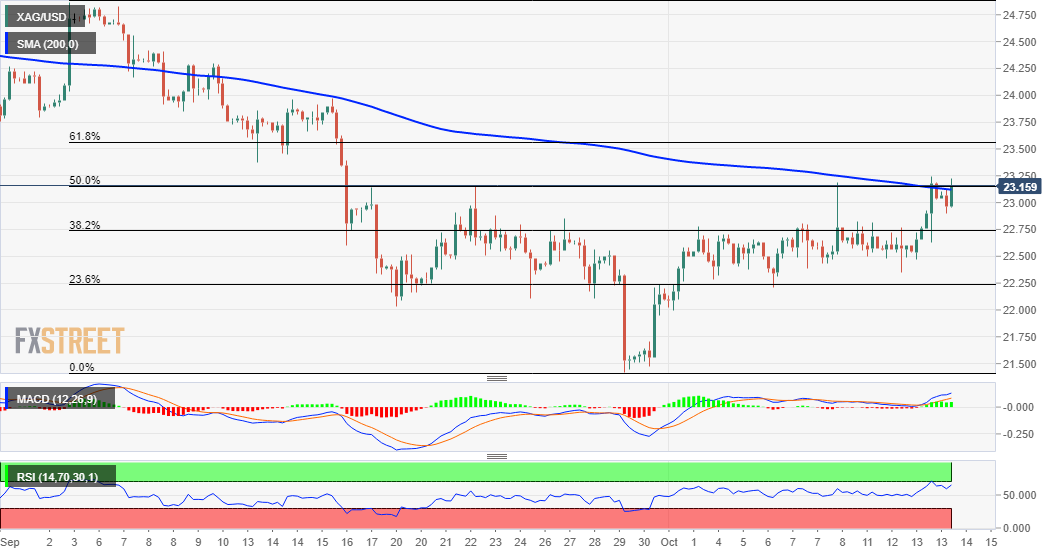
Silver reversed an intraday dip to the $22.90 area and inched back closer to near one-month tops touched in the previous day. The white metal was last seen trading near the $23.20 region, up around 0.40% for the day.

The mentioned are marks a confluence hurdle comprising of 200-period SMA on the 4-hour chart and the 50% Fibonacci level of the $24.87-$21.42 downfall. A sustained move beyond will be seen as a fresh trigger for bullish traders and set the stage for a further near-term appreciating move.

Meanwhile, technical indicators on hourly charts maintained their bullish bias and have just started gaining positive traction on the daily chart. The set-up seems tilted firmly in favour of bullish traders and supports prospects for an eventual break through the mentioned confluence barrier.

The XAG/USD might then accelerate the momentum towards the 61.8% Fibo. level, around the $23.55-60 area, before aiming to reclaim the $24.00 mark. Some follow-through buying beyond the $24.25-30 region would expose September monthly swing highs resistance near the $24.75-80 zone.

On the flip side, any meaningful slide below the $23.00 round figure might be seen as a buying opportunity and remain limited near the 38.2% Fibo. level, around the $22.75 region. That said, sustained weakness below might accelerate the slide back towards the $22.25-20 static support.

The latter coincides with the 23.6% Fibo. level, which if broken decisively will shift the bias back in favour of bearish traders. The XAG/USD might then turn vulnerable to break below the $22.00 mark and slide further towards challenging YTD lows, around the $21.45-40 region.

Silver 4-hour chart

fxsoriginal

Technical levels to watch

XAG/USD

Overview
Today last price 23.16
Today Daily Change 0.06
Today Daily Change % 0.26
Today daily open 23.1
 
Trends
Daily SMA20 22.52
Daily SMA50 23.33
Daily SMA100 24.84
Daily SMA200 25.57
 
Levels
Previous Daily High 23.25
Previous Daily Low 22.47
Previous Weekly High 23.19
Previous Weekly Low 22.21
Previous Monthly High 24.87
Previous Monthly Low 21.42
Daily Fibonacci 38.2% 22.95
Daily Fibonacci 61.8% 22.76
Daily Pivot Point S1 22.63
Daily Pivot Point S2 22.16
Daily Pivot Point S3 21.85
Daily Pivot Point R1 23.41
Daily Pivot Point R2 23.72
Daily Pivot Point R3 24.19


Share: Feed news

Information on these pages contains forward-looking statements that involve risks and uncertainties. Markets and instruments profiled on this page are for informational purposes only and should not in any way come across as a recommendation to buy or sell in these assets. You should do your own thorough research before making any investment decisions. FXStreet does not in any way guarantee that this information is free from mistakes, errors, or material misstatements. It also does not guarantee that this information is of a timely nature. Investing in Open Markets involves a great deal of risk, including the loss of all or a portion of your investment, as well as emotional distress. All risks, losses and costs associated with investing, including total loss of principal, are your responsibility. The views and opinions expressed in this article are those of the authors and do not necessarily reflect the official policy or position of FXStreet nor its advertisers. The author will not be held responsible for information that is found at the end of links posted on this page.

If not otherwise explicitly mentioned in the body of the article, at the time of writing, the author has no position in any stock mentioned in this article and no business relationship with any company mentioned. The author has not received compensation for writing this article, other than from FXStreet.

FXStreet and the author do not provide personalized recommendations. The author makes no representations as to the accuracy, completeness, or suitability of this information. FXStreet and the author will not be liable for any errors, omissions or any losses, injuries or damages arising from this information and its display or use. Errors and omissions excepted.

The author and FXStreet are not registered investment advisors and nothing in this article is intended to be investment advice.

Recommended content


Recommended content

Editors’ Picks

USD/JPY jumps above 156.00 on BoJ's steady policy

USD/JPY jumps above 156.00 on BoJ's steady policy

USD/JPY has come under intense buying pressure, surging past 156.00 after the Bank of Japan kept the key rate unchanged but tweaked its policy statement. The BoJ maintained its fiscal year 2024 and 2025 core inflation forecasts, disappointing the Japanese Yen buyers. 

USD/JPY News

AUD/USD consolidates gains above 0.6500 after Australian PPI data

AUD/USD consolidates gains above 0.6500 after Australian PPI data

AUD/USD is consolidating gains above 0.6500 in Asian trading on Friday. The pair capitalizes on an annual increase in Australian PPI data. Meanwhile, a softer US Dollar and improving market mood also underpin the Aussie ahead of the US PCE inflation data. 

AUD/USD News

Gold price flatlines as traders look to US PCE Price Index for some meaningful impetus

Gold price flatlines as traders look to US PCE Price Index for some meaningful impetus

Gold price lacks any firm intraday direction and is influenced by a combination of diverging forces. The weaker US GDP print and a rise in US inflation benefit the metal amid subdued USD demand. Hawkish Fed expectations cap the upside as traders await the release of the US PCE Price Index.

Gold News

Stripe looks to bring back crypto payments as stablecoin market cap hits all-time high

Stripe looks to bring back crypto payments as stablecoin market cap hits all-time high

Stripe announced on Thursday that it would add support for USDC stablecoin, as the stablecoin market exploded in March, according to reports by Cryptocompare.

Read more

US economy: Slower growth with stronger inflation

US economy: Slower growth with stronger inflation

The US Dollar strengthened, and stocks fell after statistical data from the US. The focus was on the preliminary estimate of GDP for the first quarter. Annualised quarterly growth came in at just 1.6%, down from the 2.5% and 3.4% previously forecast.

Read more

Forex MAJORS

Cryptocurrencies

Signatures