Silver Price Analysis: XAG/USD bulls have the upper hand above 200-hour SMA


  • Silver seems to struggle to capitalize on its modest intraday uptick on Wednesday.
  • Acceptance above the 200-hour SMA supports prospects for some meaningful gains.
  • A sustained break below the $21.00 mark is needed to negate the positive outlook.

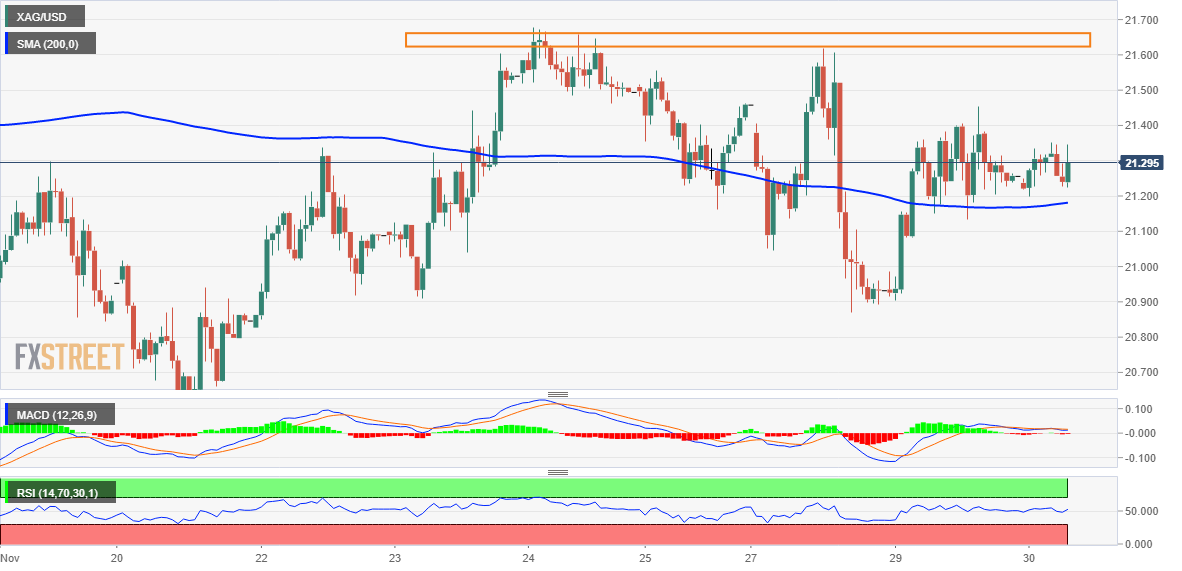
Silver edges higher on Wednesday, albeit lacks bullish conviction and remains below the overnight swing high through the early European session. The white metal is currently placed around the $21.30-$21.35 area and so far, has managed to hold above the 200-hour SMA.

From a technical perspective, the overnight goodish intraday rally from static support just below the $21.00 mark favours bullish traders. Furthermore, positive oscillators on hourly/daily charts support prospects for some meaningful intraday upside for the XAG/USD.

That said, any subsequent move up might continue to confront stiff resistance near the $21.60-$21.70 supply zone. Some follow-through buying should allow the XAG/USD to reclaim the $22.00 round-figure mark and retest a five-month high, around the $22.25 zone.

On the flip side, the 200-hour SMA, currently around the $21.15 area, is likely to protect the immediate downside ahead of the $21.00-$20.90 strong support. A convincing break below the latter could negate the positive outlook and shift the bias in favour of bearish traders.

The XAG/USD might then accelerate the downfall to the $20.60-$20.55 area before eventually dropping to challenge the $20.00 psychological mark. The downward trajectory could further get extended towards a strong horizontal resistance breakpoint, around the $19.60 region.

Silver 1-hour chart

fxsoriginal

Key levels to watch

XAG/USD

Overview
Today last price 21.31
Today Daily Change 0.07
Today Daily Change % 0.33
Today daily open 21.24
 
Trends
Daily SMA20 21.08
Daily SMA50 20.02
Daily SMA100 19.65
Daily SMA200 21.34
 
Levels
Previous Daily High 21.45
Previous Daily Low 20.89
Previous Weekly High 21.68
Previous Weekly Low 20.58
Previous Monthly High 21.24
Previous Monthly Low 18.09
Daily Fibonacci 38.2% 21.24
Daily Fibonacci 61.8% 21.11
Daily Pivot Point S1 20.94
Daily Pivot Point S2 20.64
Daily Pivot Point S3 20.38
Daily Pivot Point R1 21.5
Daily Pivot Point R2 21.76
Daily Pivot Point R3 22.06


Share: Feed news

Information on these pages contains forward-looking statements that involve risks and uncertainties. Markets and instruments profiled on this page are for informational purposes only and should not in any way come across as a recommendation to buy or sell in these assets. You should do your own thorough research before making any investment decisions. FXStreet does not in any way guarantee that this information is free from mistakes, errors, or material misstatements. It also does not guarantee that this information is of a timely nature. Investing in Open Markets involves a great deal of risk, including the loss of all or a portion of your investment, as well as emotional distress. All risks, losses and costs associated with investing, including total loss of principal, are your responsibility. The views and opinions expressed in this article are those of the authors and do not necessarily reflect the official policy or position of FXStreet nor its advertisers. The author will not be held responsible for information that is found at the end of links posted on this page.

If not otherwise explicitly mentioned in the body of the article, at the time of writing, the author has no position in any stock mentioned in this article and no business relationship with any company mentioned. The author has not received compensation for writing this article, other than from FXStreet.

FXStreet and the author do not provide personalized recommendations. The author makes no representations as to the accuracy, completeness, or suitability of this information. FXStreet and the author will not be liable for any errors, omissions or any losses, injuries or damages arising from this information and its display or use. Errors and omissions excepted.

The author and FXStreet are not registered investment advisors and nothing in this article is intended to be investment advice.

Recommended content


Recommended content

Editors’ Picks

EUR/USD clings to daily gains above 1.0650

EUR/USD clings to daily gains above 1.0650

EUR/USD gained traction and turned positive on the day above 1.0650. The improvement seen in risk mood following the earlier flight to safety weighs on the US Dollar ahead of the weekend and helps the pair push higher.

EUR/USD News

GBP/USD recovers toward 1.2450 after UK Retail Sales data

GBP/USD recovers toward 1.2450 after UK Retail Sales data

GBP/USD reversed its direction and advanced to the 1.2450 area after touching a fresh multi-month low below 1.2400 in the Asian session. The positive shift seen in risk mood on easing fears over a deepening Iran-Israel conflict supports the pair.

GBP/USD News

Gold holds steady at around $2,380 following earlier spike

Gold holds steady at around $2,380 following earlier spike

Gold stabilized near $2,380 after spiking above $2,400 with the immediate reaction to reports of Israel striking Iran. Meanwhile, the pullback seen in the US Treasury bond yields helps XAU/USD hold its ground.

Gold News

Bitcoin Weekly Forecast: BTC post-halving rally could be partially priced in Premium

Bitcoin Weekly Forecast: BTC post-halving rally could be partially priced in

Bitcoin price shows no signs of directional bias while it holds above  $60,000. The fourth BTC halving is partially priced in, according to Deutsche Bank’s research. 

Read more

Week ahead – US GDP and BoJ decision on top of next week’s agenda

Week ahead – US GDP and BoJ decision on top of next week’s agenda

US GDP, core PCE and PMIs the next tests for the Dollar. Investors await BoJ for guidance about next rate hike. EU and UK PMIs, as well as Australian CPIs also on tap.

Read more

Forex MAJORS

Cryptocurrencies

Signatures