Silver Price Analysis: XAG/USD bears eye 200-week SMA
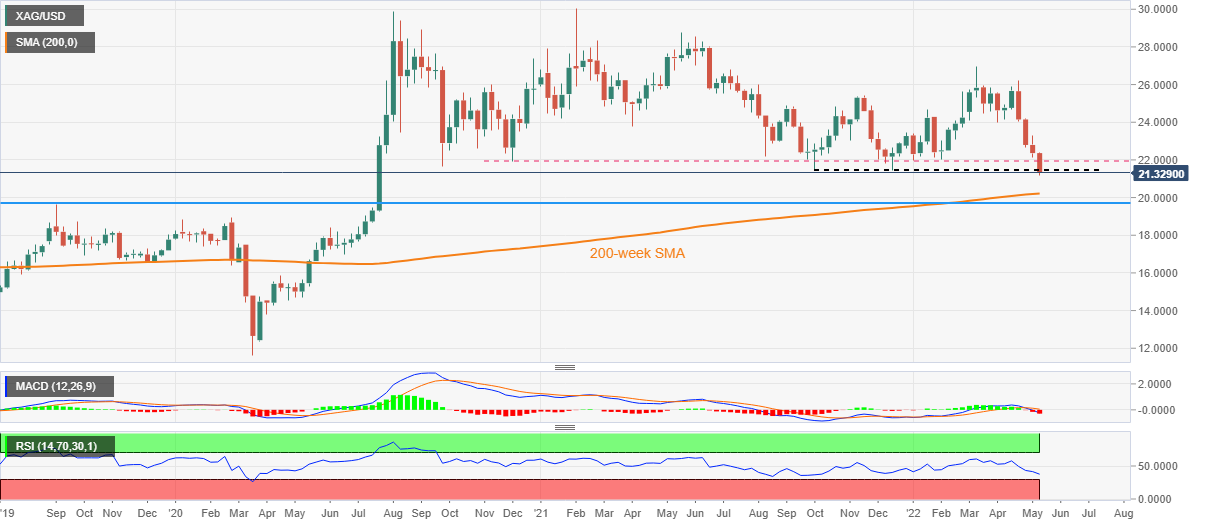
- Silver remains on the back foot after breaking seven-month-old horizontal support.
- Bearish MACD signals, downbeat RSI keep sellers hopeful.
- September 2019 peak appears a tough nut to crack for sellers, corrective pullback needs validation from $22.00.

Silver (XAG/USD) licks its wounds around a recently flashed two-year low, sidelined near $21.30 during Wednesday’s initial Asian session.
The bright metal slumped to the lowest levels since June 2020 the previous day on breaking horizontal support stretched from October 2021.
With the RSI and MACD conditions joining the latest support break, silver prices are likely to witness further downside.
That said, the 200-week SMA level surrounding $20.20 appears immediate level on the bear’s radar.
Following that, the $20.00 psychological magnet and September 2019 peak of $19.65 will challenge the further downside.
Alternatively, recovery moves beyond the support-turned-resistance around $21.45 need validation from a 17-month-long horizontal area near $22.00 to convince buyers.
Silver: Weekly chart
Trend: Bearish
Author

Anil Panchal
FXStreet
Anil Panchal has nearly 15 years of experience in tracking financial markets. With a keen interest in macroeconomics, Anil aptly tracks global news/updates and stays well-informed about the global financial moves and their implications.