|

Silver Miners ETF (SIL) surges to all-time high on impulsive breakout

The Global X Silver Miners ETF (SIL) offers investors exposure to a basket of companies engaged in silver mining worldwide. Launched in 2010, the fund seeks to replicate the performance of the Solactive Global Silver Miners Total Return Index. This gives investors efficient access to the sector in a single trade. In this article, we will look at the Elliott Wave technical outlook for the ETF.

SIL (Silver Miners ETF) monthly Elliott Wave chart

Chart

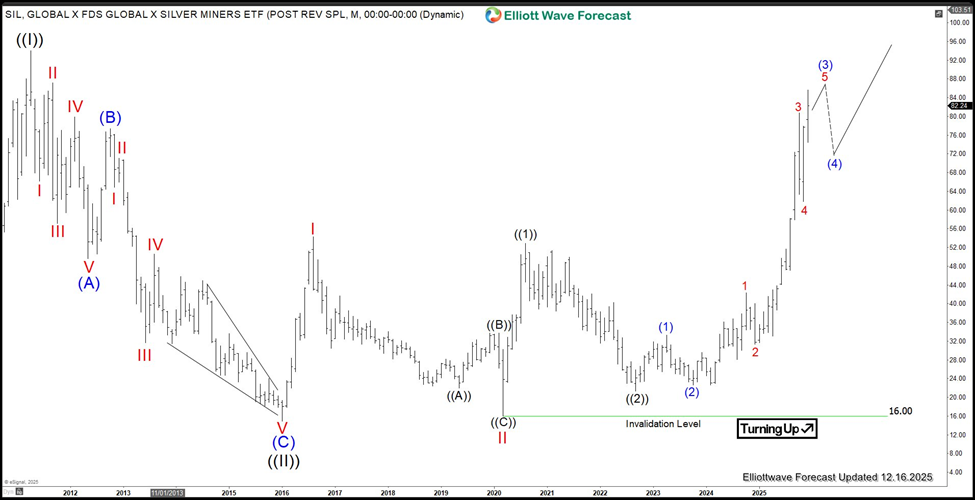
The monthly Elliott Wave chart of the Silver Miners ETF (SIL) shows that wave ((II)) of the Grand Super Cycle concluded at $14.94 in January 2016. From that low, the ETF has advanced in a nesting impulsive structure. Wave I rose to $54.34 before a corrective wave II retraced to $16. The next nesting sequence carried wave ((1)) to $52.87, followed by wave ((2)) at $21.26. As long as price remains above $16, any pullback is expected to find support within the 3, 7, or 11 swing sequence, setting the stage for continuation higher in wave ((3))

Silver Miners ETF daily Elliott Wave chart

Chart

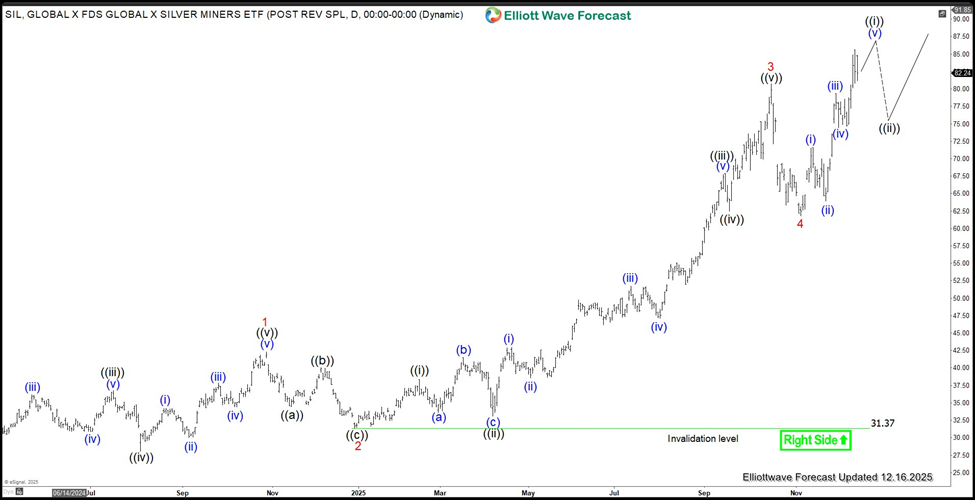
The Daily Elliott Wave chart of the Silver Miners ETF (SIL) shows that the rally from the October 4, 2025 low is unfolding as an impulse. Wave 1 peaked at $42.29, followed by a corrective wave 2 that bottomed at $31.37. The ETF then advanced in wave 3 to $80.72, before a wave 4 pullback ended at $61.80. In the near term, as long as the $31.37 pivot low remains intact, SIL should extend higher to complete wave 5 of (3). Afterwards, a larger corrective pullback should unfold to retrace the cycle from the October 4, 2025 low.

Author

Elliott Wave Forecast Team

Elliott Wave Forecast Team

ElliottWave-Forecast.com

More from Elliott Wave Forecast Team
Share:

Editor's Picks

EUR/USD treads water near 1.1800 ahead of ECB rate decision

EUR/USD is keeping its range at around 1.1800 in the European trading hours on Thursday. The pair awaits the European Central Bank interest rate decision for fresh impetus after the Eurozone inflation declined well below the central bank's 2% target. 

GBP/USD drops below 1.3600 after BoE leaves rate unchanged in close vote

GBP/USD comes under bearish pressure in the second half of the day on Thursday and trades deep in the red below 1.3600. The Bank of England left the policy rate unchanged, as expected, but four members of the MPC voted for a rate cut, causing Pound Sterling to weaken against its peers.

Gold remains under selling pressure, trades below $4,900

Gold loses its traction following an earlier recovery attempt and trades below $4,900, losing about 2% on a daily basis. The persistent US Dollar (USD) strength and the modest improvement seen in market mood doesn't allow XAU/USD to reverse its direction.

Bitcoin slips below $70,000 as falling knife scenario in play

Bitcoin (BTC) price dips below $70,000 on Thursday, having corrected nearly 20% for this year. Market momentum turned extremely bearish, with technical indicators pointing to further downside toward the next key support at $65,000.

The AI mirror just turned on tech and nobody likes the reflection

Tech just got hit with a different kind of selloff. Not the usual rates tantrum, not a recession whisper, not even an earnings miss in the classic sense. This was the market staring into an AI mirror and recoiling at its reflection.

Breaking: Bitcoin slips below $70,000 as falling knife scenario in play

Bitcoin (BTC) price dips below $70,000 on Thursday, having corrected nearly 20% for this year. Market momentum turned extremely bearish, with technical indicators pointing to further downside toward the next key support at $65,000.