Semis and AI indices take a hit – Potential double tops in play


Potential double tops are emerging across the Nasdaq 100 and semiconductor ETFs after two setbacks for the AI trade on Thursday.
What pappened?
Anthropic’s IPO lost steam. Despite opening at $111.50, Anthropic closed its first trading session at $97.17, a 12.86% decline from its opening price.
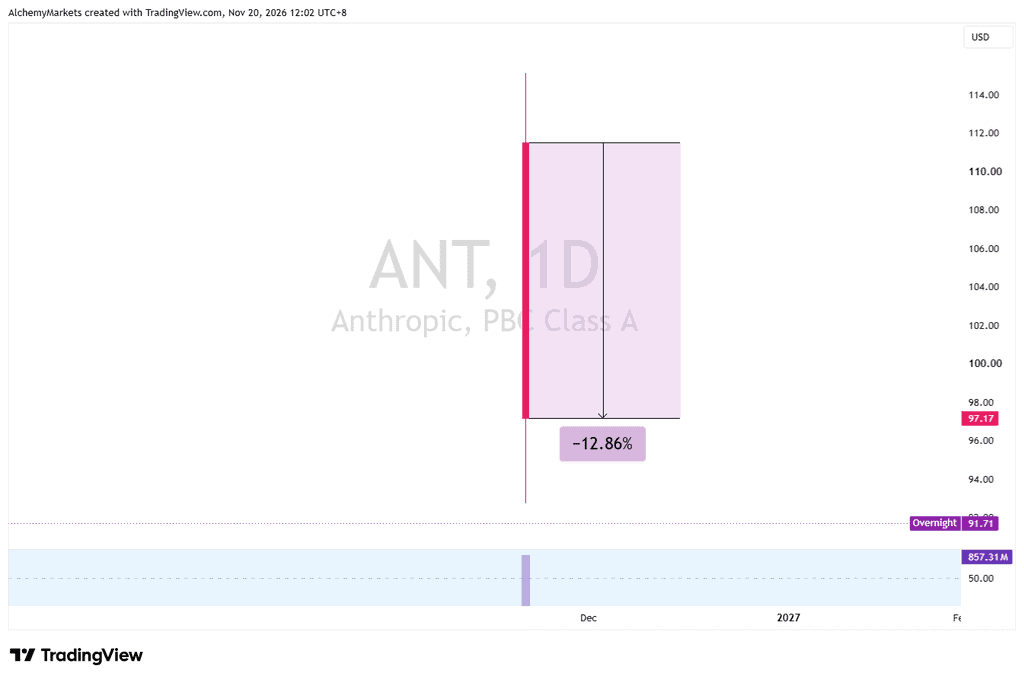
To be fair, investors who secured shares at the $83 IPO price are still up 17%. But buyers were unable to sustain Anthropic’s $2 trillion valuation on a fully diluted basis.
AMD faces fresh regulatory concerns. Shares fell around 8% after Hunterbrook alleged that blacklisted Chinese server maker IEIT Systems continued obtaining updated AMD firmware.
AMD denies any wrongdoing. Nevertheless, customers in China and Hong Kong accounted for 22% of its 2025 revenue, making tighter export restrictions a risk.
This is sending ripple effects throughout AI-related markets as investors price in escalated risks.
Semiconductor ETFs: Two potential double tops
SMH and SOXX have broken below their respective double top necklines and are approaching their 100 EMA Bollinger Bands (0.5 SD) on the weekly charts.
In early 2025, both ETFs tested their 200 EMA bands (0.25 SD) after losing the 100 EMA bands. Should the blue bands give way again, the purple bands become important.
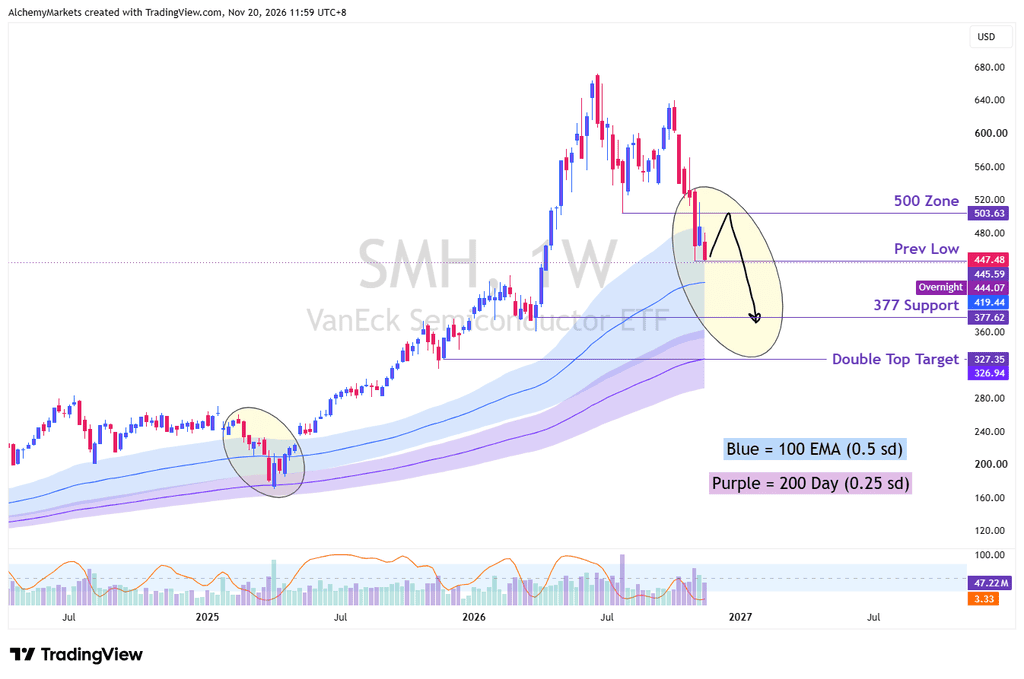
For SMH, a rebound towards $500 could be a neckline retest.
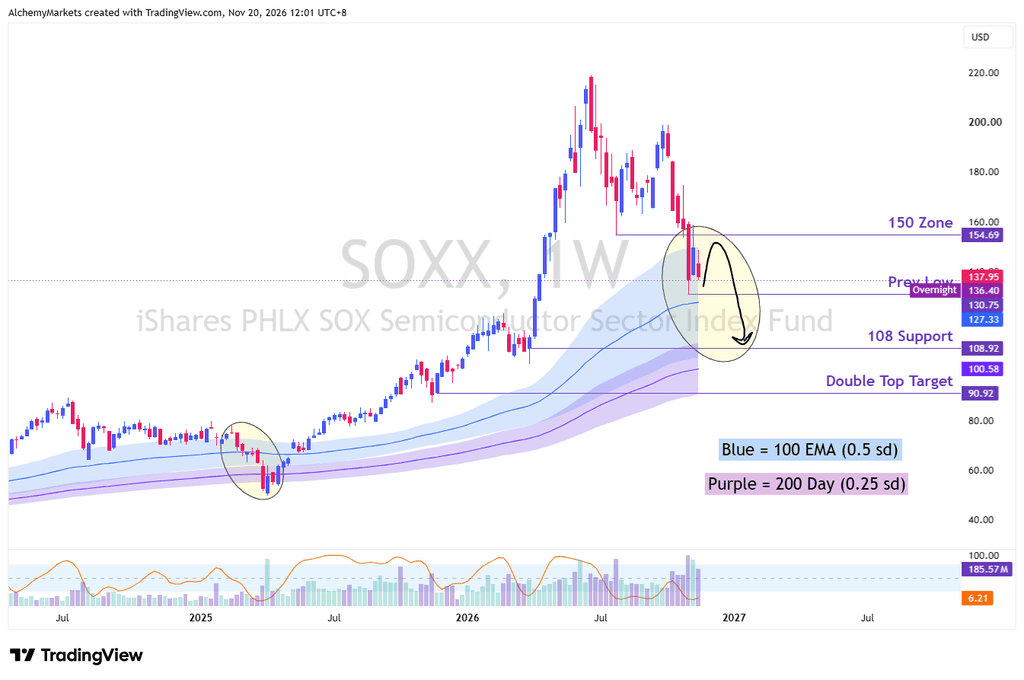
SOXX has a similar setup around $150–155. Unless the ETFs reclaim these necklines, the double tops remain in play.
Robotics and AI ETFs
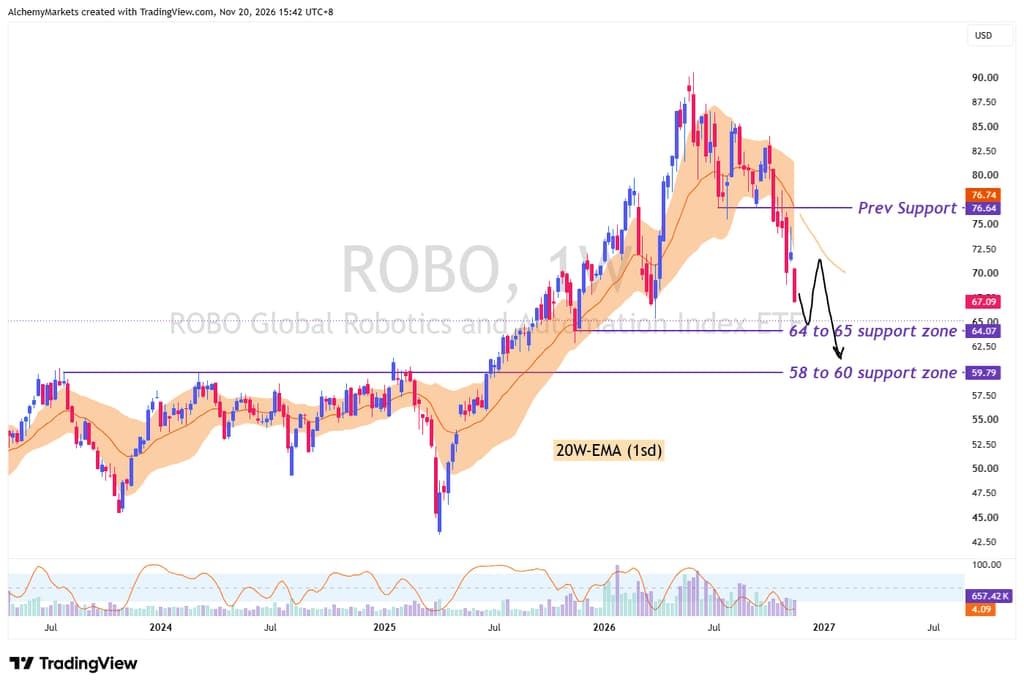
ROBO is trading into weekly support, but its 20-week EMA (1 SD) band and previous support has flipped into potential resistance.
CHAT: Generative AI and technology ETF
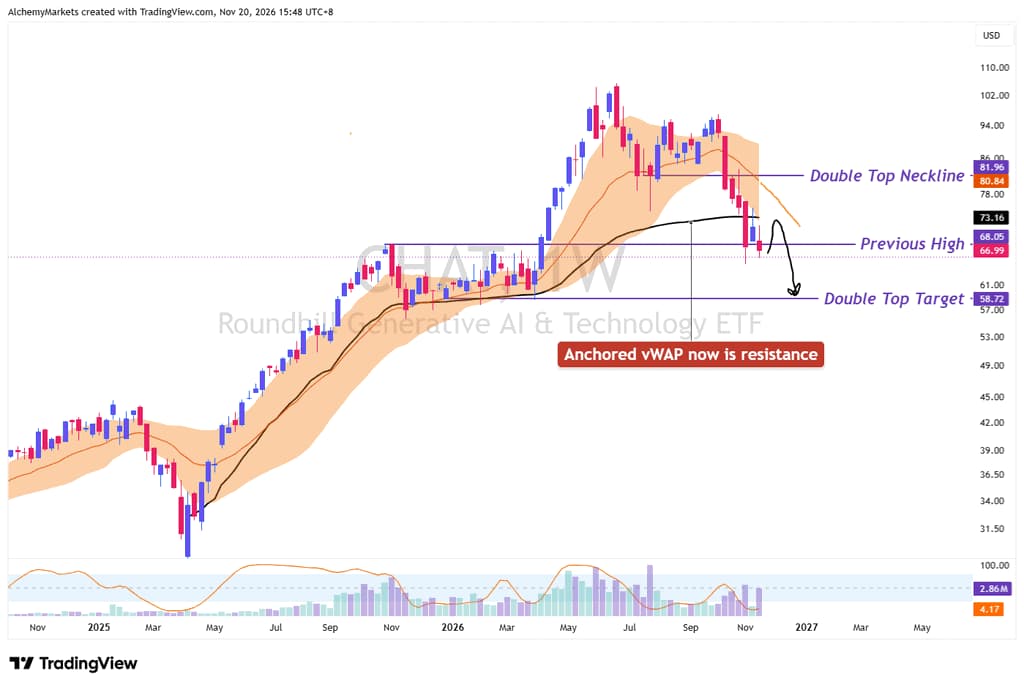
CHAT looks particularly interesting as it is an ETF that is directly composed of generative AI stocks.
Like the others, a double top pattern can be spotted and we are nearing its target at around 57 to 60.
The ETF had been trailing its 20-week EMA (1 SD) band throughout the rally. That band has now broken, as have the anchored vWAP supporting this rally.
Should CHAT bounce, watch for resistance at the anchored VWAP around $73.16, followed by the 20-week EMA band.
Nasdaq 100 (USTEC): 26,000 is key
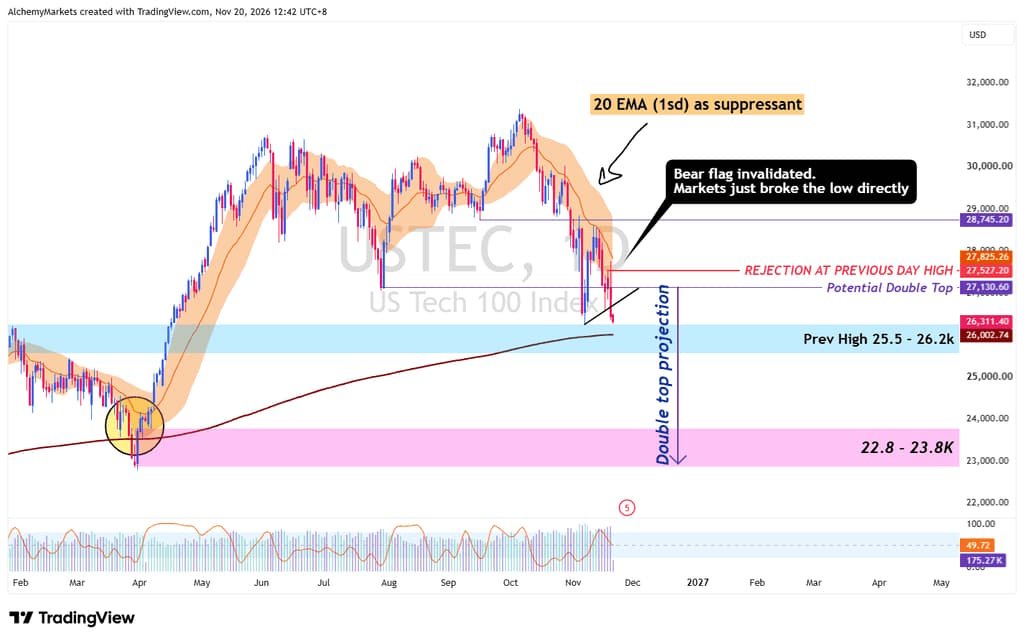
USTEC remains suppressed by its 20-day EMA (1 SD) band and has broken below the double top neckline.
However, its anchored VWAP near 26,000 coincides with its previous highs, potentially setting up a bounce.
Failure to bounce here could lead to much lower targets at 22.8K to 23.8K.
Bottom Line: The AI trade continues to look shaky by the day. While this could be setting up an incredible discount for investors, there are no signs for a bullish reversal as of now.
Author
Zorrays Junaid
Alchemy Markets
Zorrays Junaid has extensive combined experience in the financial markets as a portfolio manager and trading coach. More recently, he is an Analyst with Alchemy Markets, and has contributed to DailyFX and Elliott Wave Forecast in the past.

















