PANW analysis: Elliott Wave forecasting bullish sequence above $300

PANW has maintained a very strong bullish sequence from the June 2013 low. The strong 5-wave sequence appears to be in the final lap. While the 5th wave could extend to prices above $300, how could traders take advantage?
Palo Alto Networks (NASDAQ: PANW) is a global cybersecurity leader providing advanced network security, cloud protection, and AI-driven threat detection solutions for enterprises and governments worldwide. The company helps organizations secure digital operations across cloud, hybrid, and on-premise environments through its integrated platforms and automation tools. PANW has remained one of the strongest names in the cybersecurity sector.
PANW Elliott Wave analysis – Weekly chart
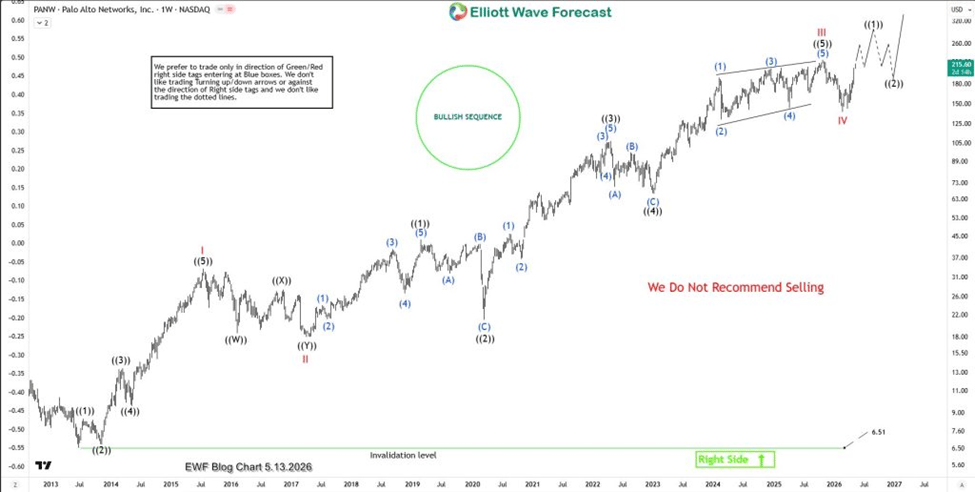
The weekly chart above displays a robust impulse wave sequence originating from the June 2013 low. Following this, wave I concluded at the July 2015 high. Subsequently, a 7-swing correction characterized wave II, concluding in March 2017. Beginning from the March 2017 low, wave III initiated and completed a clear impulse wave sequence, with its 5th wave structured as an ending diagonal. Wave III peaked in October 2025, establishing a record high for the stock, with a highly probable breach anticipated soon. The subsequent wave IV pullback seems shallow; however, the ensuing resurgence suggests the price is currently within wave V.
At the end of wave V, the stock will complete the impulse cycle from June 2013 in wave (I), which will then be followed by a deep correction in (II). The Elliott Wave analysis suggests a near-exhausted move, something long-term investors should be aware of. In the coming months, buyers could start exiting positions and taking profits, potentially leading to a significant pullback. However, wave V appears to be still in its early stages. We can currently confirm the emergence of wave ((1)) of I, which seems to be in the 3rd wave.
We anticipate wave ((1)) to break to a new high before wave ((2)) begins. This is because the 3rd wave of ((1)) is already near its top, making it relatively easy for wave ((1)) to establish a new record high. So, after this potential breach, what should we expect next?
How should traders engage PANW
If wave ((1)) breaks above wave III as anticipated, medium-term traders can look to buy dips at the extreme of wave ((2)). We anticipate the February 23rd low to provide necessary support for the development of wave V. Below the February 23rd low, we could see an early indication of (II), particularly if a new high was achieved beforehand. If not, we will consider wave IV to be lower and buy at its extreme. Since wave IV is currently shallow, we cannot rule out a deeper correction until a new high is reached. Overall, the upside should remain. Thus, traders should buy the dips off wave ((2)) ideally or a deeper IV if by the slight chance it didn’t make a new high prior.
Author

Elliott Wave Forecast Team
ElliottWave-Forecast.com


