OPEN stock: Real value emerging or just a retail trap?

OPEN ’s makes selling homes easier by offering fast cash offers. Then, it repairs and resells the homes through its platform. Buyers also complete their purchases online. This digital process cuts delays and avoids agent fees. As a result, customers save time and money. Recently, Opendoor added AI tools to improve pricing. Investors now see potential for scalable growth. Still, the company reports losses despite rising demand. Therefore, analysts stay cautious about long-term profits.
Opendoor’s stock soared in 2025, climbing nearly 500% year-to-date. This surge followed a major leadership change. Shopify’s former COO Kaz Nejatian became CEO. Co-founders Keith Rabois and Eric Wu also returned to the board. Investors welcomed the shift and bet on a tech-driven comeback. Moreover, Opendoor announced a new AI-first strategy with $40 million in funding. Nejatian stressed using modern tools to simplify homeownership. This move supports Opendoor’s goal to streamline real estate deals.
Still, challenges remain. The business model is not yet proven. Losses continue despite strong demand. Some analysts predict a price drop to $1.46. Volatility stays high, driven by social media buzz. If interest rates fall, housing demand may grow. That could help Opendoor improve its margins. Until then, the stock trades more on hope than results. So, long-term investors should weigh risks before buying in.
Elliott Wave outlook: Opendoor OPEN September 2025 weekly chart
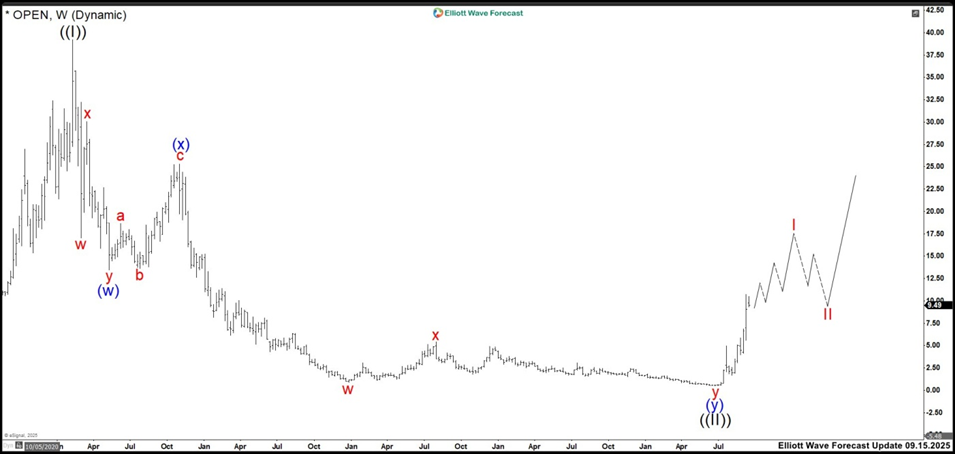
Opendoor (OPEN) completed its corrective wave ((II)) from the 2021 high to the $0.51 low. Now, it builds wave I with strong momentum. This impulse structure looks incomplete, so we expect higher prices in the short term. However, entering now remains risky. We prefer to wait for a pullback before committing. After wave I ends, we anticipate a wave II correction with 3, 7, or 11 swings. Therefore, we monitor lower timeframes to identify the best area to end the current rally.
Elliott Wave outlook: Opendoor OPEN September 2025 four-hour chart
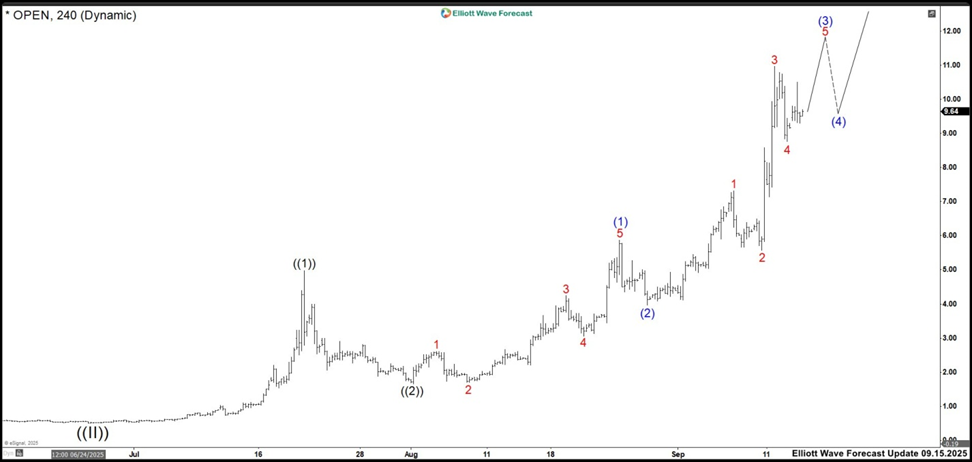
On the 4-hour chart, Opendoor trades inside wave ((3)) of I. This wave must form five upward subwaves. Currently, price moves within wave (3) of ((3)). One more push could complete wave (3) near $11.53–$12.39. After that, we expect a pullback as wave (4) before the rally resumes. However, price may extend beyond this zone. If no correction appears, we must adjust the impulse count.
We still expect to continue to the upside until a strong bearish reaction confirms wave I is completed. Once wave I ends, we can estimate wave II’s correction zone. That area will be broad and imprecise because OPEN is highly volatile, and we must review the structure weekly. This helps improve timing and entry. For now, we are waiting for a clear bearish signal before looking for buying opportunities.
Author

Elliott Wave Forecast Team
ElliottWave-Forecast.com


