The Dow Jones Industrial Average rallies as escalation gets a price list
- DJIA trades near 52,400, up around 200 points and outrunning both the S&P 500 and the NASDAQ.
- Crude Oil sits at one-month highs after an 11th straight round of US strikes on Iran.
- Earnings from Dow component Alphabet lands after the bell.

The Dow Jones Industrial Average (DJIA) trades near 52,400 on Wednesday, up around 200 points and on track for a second consecutive daily gain, while the S&P 500 hugs the flatline and the NASDAQ Composite slips into the red. The blue-chip index dipped to just above the 52,000 handle early, repaired the damage in stages, and pressed just above 52,500 before easing back toward 52,400, where it changes hands late in the session.
With the US data docket functionally barren until Thursday, the session belongs to macro headlines and the earnings tape, and the split across the three benchmarks is the day's cleanest tell. A war that lifts input costs lands as a tax on long-duration growth, while the Dow's tilt toward energy, staples and industrials converts the same headlines into relative shelter.
Escalation gets a price list
The overnight war news reads like a rate card, with US forces running an 11th consecutive round of strikes on Iran and Secretary of State Marco Rubio declaring that Tehran is not serious about negotiations while pledging continued American protection for shipping through the Strait of Hormuz. Trump went a step further and attached a unit price to the campaign, promising an Iranian bridge or power plant destroyed for every ship attacked in the waterway.
Tehran is reportedly massing additional strike capability along the Strait rather than standing down, which converts the new formula from a deterrent into a metronome. Crude Oil took the hint, with West Texas Intermediate (WTI) trading above $86.00 and Brent above $93.00 after briefly clearing the $95.00 handle, both up around 2% at levels last seen in mid-June.
Equities have spent two weeks looking through this conflict toward the earnings calendar, and Wednesday extends the habit with a twist, because the index least exposed to expensive growth is the one collecting the bid. Higher energy costs and a live rates conversation weigh harder on the NASDAQ's multiples than on a benchmark carrying an Oil major and a defense-heavy industrial bench.
Earnings carry the week the Fed vacated
The season's scoreboard keeps funding the optimism, with roughly 88% of the early S&P 500 reporters beating profit estimates and Tuesday's beats from 3M (MMM) and General Motors (GM) still echoing through the cyclical complex. Wednesday's after-bell docket is the real event risk, with Alphabet (GOOG), Tesla (TSLA), ServiceNow (NOW), Texas Instruments (TXN) and International Business Machines (IBM) all reporting, and the market wants order books and capital-spending guidance more than another beat over a lowered bar.
IBM is the print that matters most for this index, because the Dow weighs components by share price and the stock has already been the story once this month. A mid-July profit warning erased roughly a quarter of the company's value in one session, the worst day for the shares in decades, and by house math that single move subtracted more than 400 points from the index. Tonight's numbers either confirm the damage is contained or reopen it.
The rest of the tape hums with single-name noise, with Super Micro Computer (SMCI) up around 24% on a blowout order forecast, AT&T (T) up 3% on a clean beat, GE Vernova (GEV) down 5% on a miss, and Reddit (RDDT) down 9% on a report it may wall off its content from Google's artificial intelligence use.
Trump also opened a new tariff front, promising a 100% levy on imported generic drugs from August 2028 and 200% a year after that, an onshoring project with a fuse long enough to be somebody else's problem. Treasury yields barely moved on any of it, with the 10-year holding near 4.63%, which reads as a bond market saving its verdict for next week.
The docket refills from Thursday
The data drought breaks gently, with weekly Initial Jobless Claims due Thursday at 12:30 GMT, where consensus looks for 212K after 208K, and Friday's flash July PMI surveys at 13:45 GMT, where Manufacturing is expected to firm to 54.5 from 53.9 alongside a services reading near 51. June New Home Sales follow after a 7.3% drop the month before.
The louder calendar sits a week out, with the Federal Reserve due to deliver its next rate decision on Wednesday, July 29, and the committee already inside its pre-meeting blackout, so the tape gets no official steer between now and the statement. Durable Goods, Consumer Confidence and the June Personal Consumption Expenditures report bracket that meeting, which makes next week the bill for this one's quiet.
Technical levels to watch
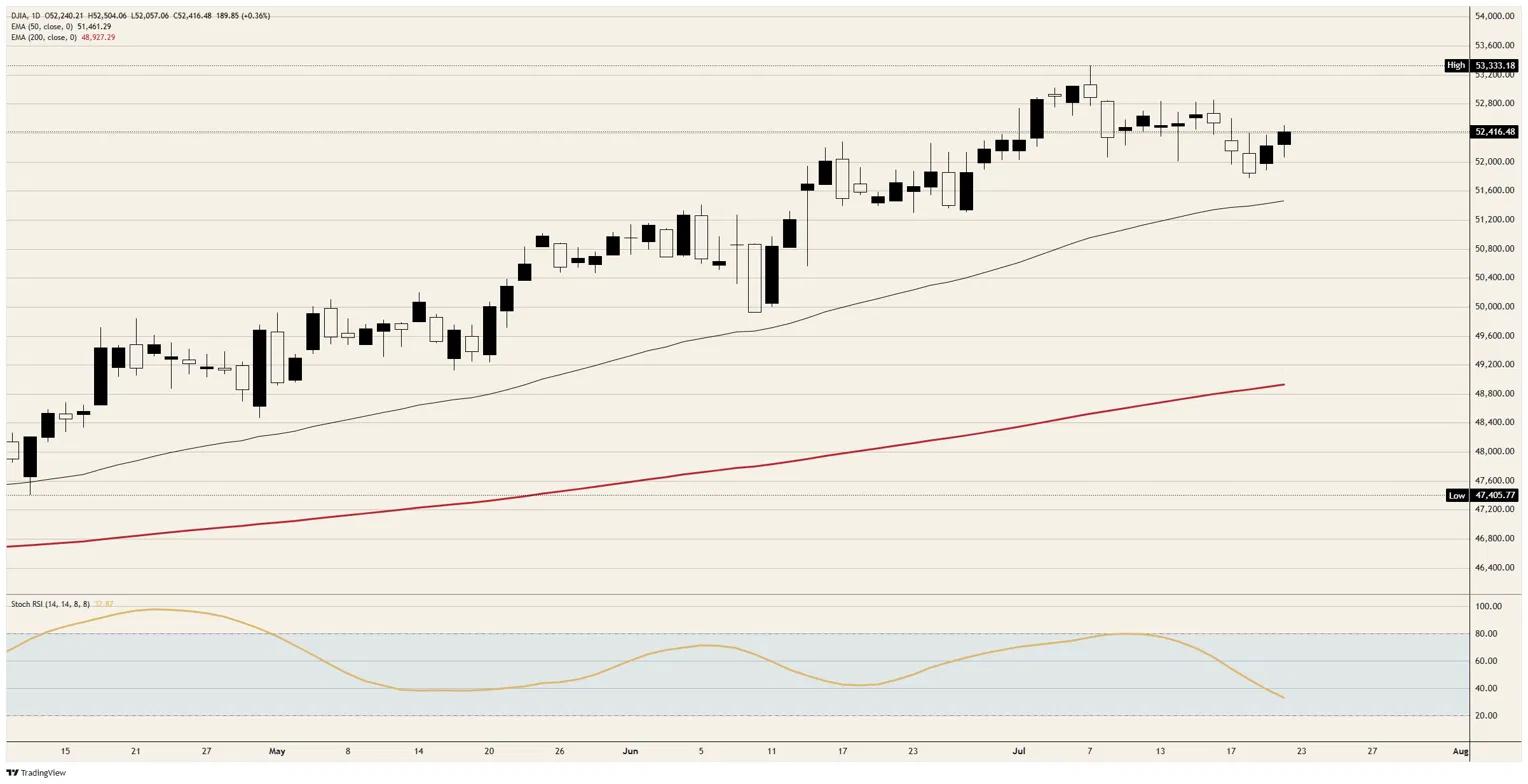
Resistance: The session high just above 52,500 is the first cap, backed by the mid-July supply shelf around 52,800 and the early-July record just above 53,300, roughly 900 points overhead.
Support: The 52,000 handle absorbed the early dip and remains the working floor, with the weekly low near 51,800 beneath it and the rising 50-day Exponential Moving Average (EMA) just below 51,500 as the deeper backstop.
Bias: Bullish while the index holds the 52,000 handle, though a daily Stochastic Relative Strength Index near 33 and falling says the grind runs on thinner momentum; a daily close below 51,800 invalidates the call and exposes the 50-day.
Dow Jones daily chart
Dow Jones FAQs
The Dow Jones Industrial Average, one of the oldest stock market indices in the world, is compiled of the 30 most traded stocks in the US. The index is price-weighted rather than weighted by capitalization. It is calculated by summing the prices of the constituent stocks and dividing them by a factor, currently 0.152. The index was founded by Charles Dow, who also founded the Wall Street Journal. In later years it has been criticized for not being broadly representative enough because it only tracks 30 conglomerates, unlike broader indices such as the S&P 500.
Many different factors drive the Dow Jones Industrial Average (DJIA). The aggregate performance of the component companies revealed in quarterly company earnings reports is the main one. US and global macroeconomic data also contributes as it impacts on investor sentiment. The level of interest rates, set by the Federal Reserve (Fed), also influences the DJIA as it affects the cost of credit, on which many corporations are heavily reliant. Therefore, inflation can be a major driver as well as other metrics which impact the Fed decisions.
Dow Theory is a method for identifying the primary trend of the stock market developed by Charles Dow. A key step is to compare the direction of the Dow Jones Industrial Average (DJIA) and the Dow Jones Transportation Average (DJTA) and only follow trends where both are moving in the same direction. Volume is a confirmatory criteria. The theory uses elements of peak and trough analysis. Dow’s theory posits three trend phases: accumulation, when smart money starts buying or selling; public participation, when the wider public joins in; and distribution, when the smart money exits.
There are a number of ways to trade the DJIA. One is to use ETFs which allow investors to trade the DJIA as a single security, rather than having to buy shares in all 30 constituent companies. A leading example is the SPDR Dow Jones Industrial Average ETF (DIA). DJIA futures contracts enable traders to speculate on the future value of the index and Options provide the right, but not the obligation, to buy or sell the index at a predetermined price in the future. Mutual funds enable investors to buy a share of a diversified portfolio of DJIA stocks thus providing exposure to the overall index.
Author

Joshua Gibson
FXStreet
Joshua joins the FXStreet team as an Economics and Finance double major from Vancouver Island University with twelve years' experience as an independent trader focusing on technical analysis.