|

NZD/USD recovers into 0.5850 as risk aversion recedes, for now

  • The NZD/USD is getting some much-needed lift heading into the Tuesday market session.
  • Thin New Zealand showing on the economic calendar to leave the Kiwi exposed to USD flows.
  • Later Tuesday sees another round of US PMI data for October.

The NZD/USD is catching some bids into 0.5850 as broad market risk appetite stabilizes heading into a bumper week of US data readings.

The economic calendar is notably absent any meaningful Kiwi-based figures for NZD traders to chew on, leaving the NZD/USD to get pushed around by market reactions to US growth and inflation figures.

Tuesday sees US Purchasing Manager Index (PCI) figures for October, and both components of the PMI are forecast to decline, albeit slightly: the Manufacturing PMI is expected to tick down from 49.8 to 49.5, while the Services PMI is seen declining from 50.1 to 49.9, slipping back into expected contraction territory to match manufacturing expectations.

Wednesday follows up with a speech from Federal Reserve (Fed) Chairman Jerome Powell, followed by US Gross Domestic Product (GDP) figures on Thursday; US GDP is expected to accelerate in the third quarter, from 2.1% to 4.2% for the annualized period into 3Q.

Friday will close out the trading week with another inflation headline for the US: Personal Consumption Expenditure (PCE) Index data for September is expected to increase from 0.1% to 0.3%.

Accelerations in underlying inflation figures for the US bode poorly for broad market sentiment as investors are hoping for a walk back on interest rate expectations from the Fed, but sticky inflation will prove a difficult hurdle for the US central bank to overcome before they can start bringing rates down. The Fed's current "dot plot" doesn't see any rate cuts until the latter half of 2024 as it currently stands.

NZD/USD Technical Outlook

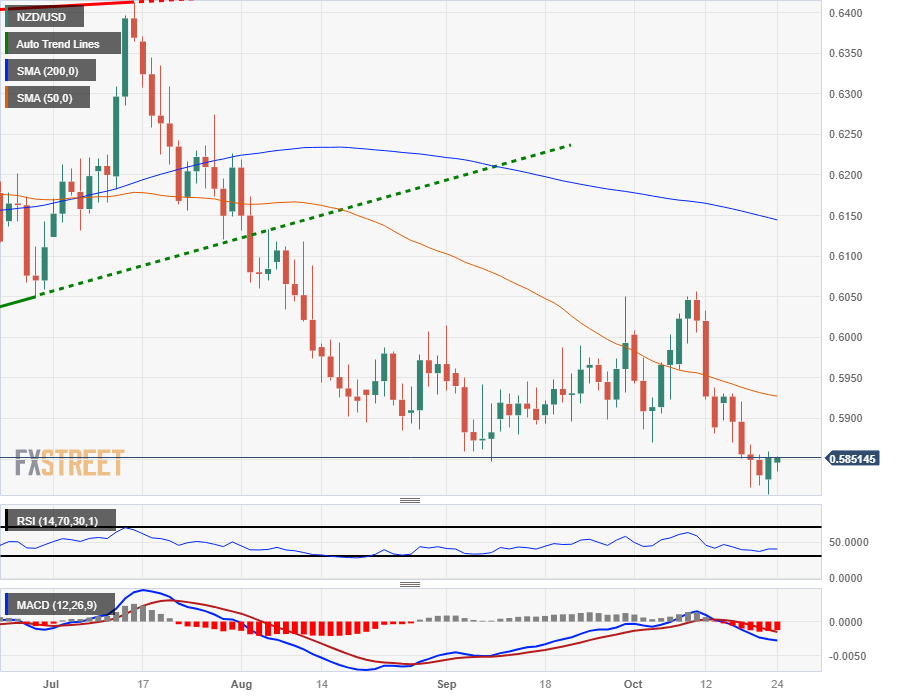
The Kiwi remains trapped under long-term bearish momentum despite Monday's relief rally, and the pair continues to waffle near twelve-month lows.

Technical support is limited just north of the 0.5800 handle, while the 50-day Simple Moving Average (SMA) is punishing down on price action from 0.5927.

A bullish recovery will need to overcome the 0.6000 major psychological handle, with the near-term ceiling sitting at the last swing high into 0.6056, while a downside break will see the NZD/USD set for a run at old support levels originally chalked in from late 2022 near the 0.5600 level.

NZD/USD Daily Chart

NZD/USD Technical Levels

NZD/USD

Overview
Today last price0.5849
Today Daily Change0.0019
Today Daily Change %0.33
Today daily open0.583
 
Trends
Daily SMA200.5939
Daily SMA500.5932
Daily SMA1000.6048
Daily SMA2000.6149
 
Levels
Previous Daily High0.5856
Previous Daily Low0.5817
Previous Weekly High0.5931
Previous Weekly Low0.5815
Previous Monthly High0.605
Previous Monthly Low0.5847
Daily Fibonacci 38.2%0.5832
Daily Fibonacci 61.8%0.5841
Daily Pivot Point S10.5813
Daily Pivot Point S20.5795
Daily Pivot Point S30.5774
Daily Pivot Point R10.5852
Daily Pivot Point R20.5873
Daily Pivot Point R30.589

Author

Joshua Gibson

Joshua joins the FXStreet team as an Economics and Finance double major from Vancouver Island University with twelve years' experience as an independent trader focusing on technical analysis.

More from Joshua Gibson
Share:

Editor's Picks

AUD/USD languishes near two-month low amid renewed Iran tensions

AUD/USD holds above 0.7000 during the Asian session on Wednesday, though it remains close to a nearly two-month low set the previous day. Fresh US strikes on Iran temper hopes for a peace deal and benefit the safe-haven US Dollar. Furthermore, inflationary concerns continue to fuel hawkish Fed expectations, lending additional support to the buck ahead of the US CPI report. Adding to this, reduced bets on an RBA rate hike in June cap the currency pair.


USD/JPY sits near 160.50 intervention zone as bulls shrug off Japan's strong PPI

USD/JPY consolidates just below mid-160.00s, or its highest level since late April, as economic concerns stemming from the Middle East conflict continue to undermine the Japanese Yen (JPY). Furthermore, a fresh wave of US strikes on Iran benefits the safe-haven US Dollar and acts as a tailwind for the currency pair, countering Japan's hotter-than-expected PPI report. However, intervention fears cap the upside as traders seem hesitant ahead of the US consumer inflation figures later this Wednesday.

Gold flirts with $4,200, lowest since March 23 on hawkish Fed bets

Gold drops to a fresh low since March 23, around the $4,200 mark during the Asian session on Wednesday, as fresh US strikes on Iran fuel inflationary concerns and bolster bets for more hawkish central banks, including the US Fed. Meanwhile, US Dollar bulls are turning cautious ahead of the US CPI report, which could limit bullion losses. However, the recent breakdown below the 200-day SMA suggests that the path of least resistance for the XAU/USD is to the downside.

Bitcoin sell-off pushes over 50% of circulating supply into loss, hinting at market bottom

Bitcoin dropped near $61,000 on Tuesday, with the latest sell-off pushing long-term market indicators toward levels historically associated with bear-market bottoms, according to a report by K33 Research.

When the chips are down, the AI tape starts to shake

The market came into Tuesday trying to sell investors the comforting ”Turnaround Tuesday” idea that Friday’s AI fracture was just another pothole on the road higher. By the close, that story had lost its bid. Monday’s dead cat bounce had done what dead cat bounces always do.

The US economy defies the rules: 100 days into the Oil shock and the recession signal is still missing

More than three months after the start of the Iran war and the resulting disruption to global energy markets, the US economy continues to display remarkable resilience. The conflict has triggered a sharp rise in Oil prices, reignited inflationary pressures and fueled widespread concerns about a potential economic slowdown.