|

NZD/USD Price Forecast: Testing top of range and attempting to breakout

  • NZD/USD is repeatedly pushing up against the ceiling of a range it began in the spring. 
  • A break above the August 20 high would form a higher high and confirm a breakout from the range. 
  • Such a move would be expected to lead to substantial upside follow-through. 

NZD/USD continues knocking on the ceiling of the sideways range it established since the springtime. A break above the August 20 high would probably confirm an upside breakout with substantial gains expected thereafter. 

NZD/USD Daily Chart 

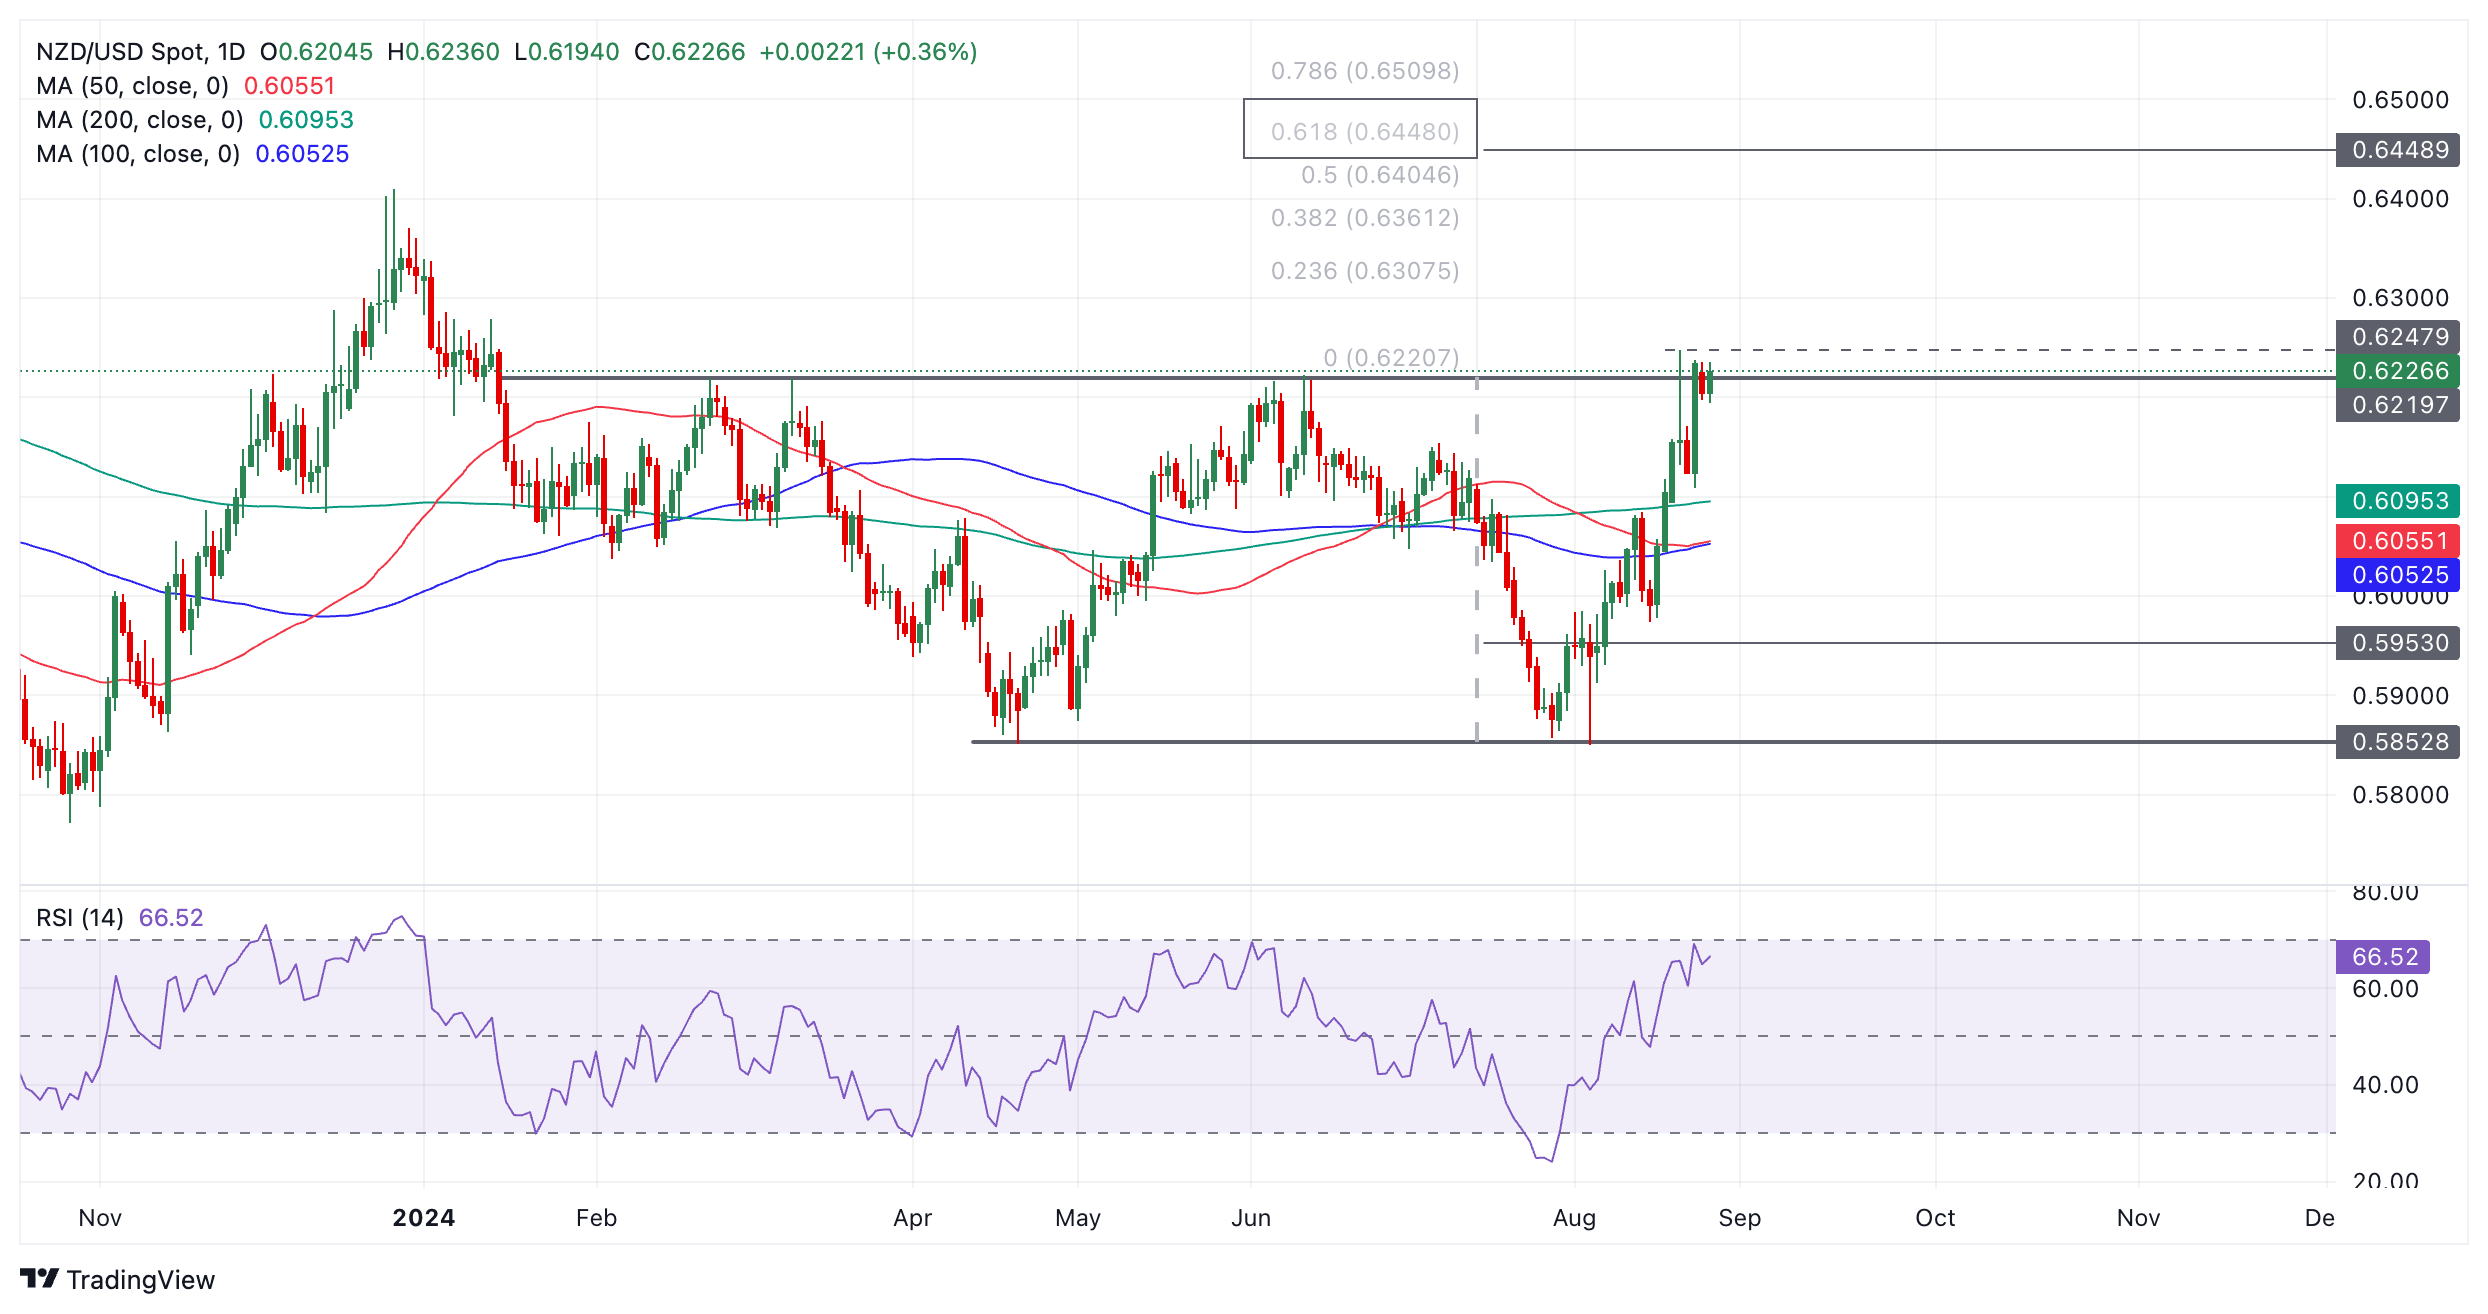
The pair temporarily breached the ceiling of its range on August 20 when it rose up to a high of 0.6248 before rapidly falling back down and forming a bearish Gravestone Doji candlestick in the process. This was followed by a red down candle which would have been expected to indicate further near-term weakness, however, the pair fell on a few points down to the 0.6109 August 22 swing low. 

NZD/USD has since recovered and continues testing the range ceiling. 

A break above the 0.6248 August 20 highs would signal a decisive breakout from the confines of the range. Such a move would then activate an upside target, calculated by taking the 0.618 ratio of the height of the range and extrapolating it higher. This would give an upside target of 0.6448 (bold rectangle). Another, more conservative target lies at 0.6409 (December 2023 high). 

Such a move would probably also change the short-term trend from sideways to bullish.

A break below the 0.6109 swing low (August 23 low), however, would reconfirm the sideways trend as intact. This would probably then see the pair move back down towards the range floor at around 0.5850.

Author

Joaquin Monfort

Joaquin Monfort is a financial writer and analyst with over 10 years experience writing about financial markets and alt data. He holds a degree in Anthropology from London University and a Diploma in Technical analysis.

More from Joaquin Monfort
Share:

Editor's Picks

AUD/USD eyes 0.7150 barrier nine-day EMA

AUD/USD inches higher after registering modest losses in the previous day, trading around 0.7130 during the Asian hours. The technical analysis of the daily chart indicates that the pair is moving sideways within the rectangle pattern, suggesting a consolidation as neither the bulls nor the bears have enough momentum to take control of the market.

USD/JPY trades below 160.00 intervention threshold; bullish bias intact

The USD/JPY pair attracts some sellers during the Asian session amid fears that authorities will step in again to prop up the Japanese Yen. Furthermore, the Israel-Lebanon truce prompts some profit-taking around the US Dollar and exerts downward pressure on the currency pair.

Gold extends rebound to $4,500 as US yields edge lower

Gold (XAU/USD) preserves its recovery momentum following Wednesday's slide and tests the $4,500 mark in the second half of the day on Thursday. While US-Iran uncertainty remains, easing tensions between Lebanon on Israel seems to be helping the market mood improve, causing the USD to lose strength alongside falling US T-bond yields and opening the door for a decisive rebound in XAU/USD.

Bitcoin’s massive storm is back: Why the sell-off is far from over

Bitcoin price action over the last few weeks has felt less like a normal, healthy correction and more like a slow grinding crash that continues to wreak havoc on holdings and trading accounts. And everything suggests that the dramatic crash isn’t over.

Nonfarm payrolls: Testing the limits of Fed policy patience

The upcoming nonfarm payrolls report for May will provide the final update on the US labor market before Kevin Warsh attends his first policy meeting as the new Fed Chair later this month.

Recession on paper: What really moves the Canadian Loonie now?

Statistics Canada handed the headline writers a gift and the analysts a headache. Real GDP shrank 0.1% on an annualized basis in the first quarter, and with the fourth quarter of 2025 revised down to a 1.0% contraction, that is two negative quarters in a row, the textbook definition of a technical recession and Canada's first since the pandemic.