NZD/USD Price Forecast: Dips below 0.5850 amid high Oil prices, risk-off markets
- NZD/USD hits two-week lows near 0.5840, on track for a more than 2% weekly decline.
- Higher US yields and escalating Oil prices are boosting the US Dollar across the board.
- New Zealand's Business NZ PMI slowed down to a seven-month low of 50.5 in April.

The New Zealand Dollar (NZD) accelerates its reversal against a stronger US Dollar (USD) on Friday. The pair trades at two-week lows right above 0.5840 at the time of writing, on track to a more than 2% weekly selloff, crushed by a risk-off sentiment amid the stalemate in the US-Iran conflict and higher Oil prices, as Brent crude reaches prices near $110.00.
The US Dollar is marching higher across the board on Friday, boosted by higher US Treasury yields amid rising expectations of Federal Reserve (Fed) rate hikes, following the US inflation data released earlier in the week. Beyond that, US President Donald Trump´s comments affirming that China has agreed to buy Oil from the US have boosted Crude prices, adding pressure on the Kiwi, as New Zealand is a net Oil importer.
In New Zealand, the Business NZ PMI, released earlier on Friday, showed that manufacturing activity slowed down to a seven-month low of 50.5 in April from 52.8 in March, which has failed to improve confidence in the Kiwi.
Technical Analysis: next support is at 0.5815
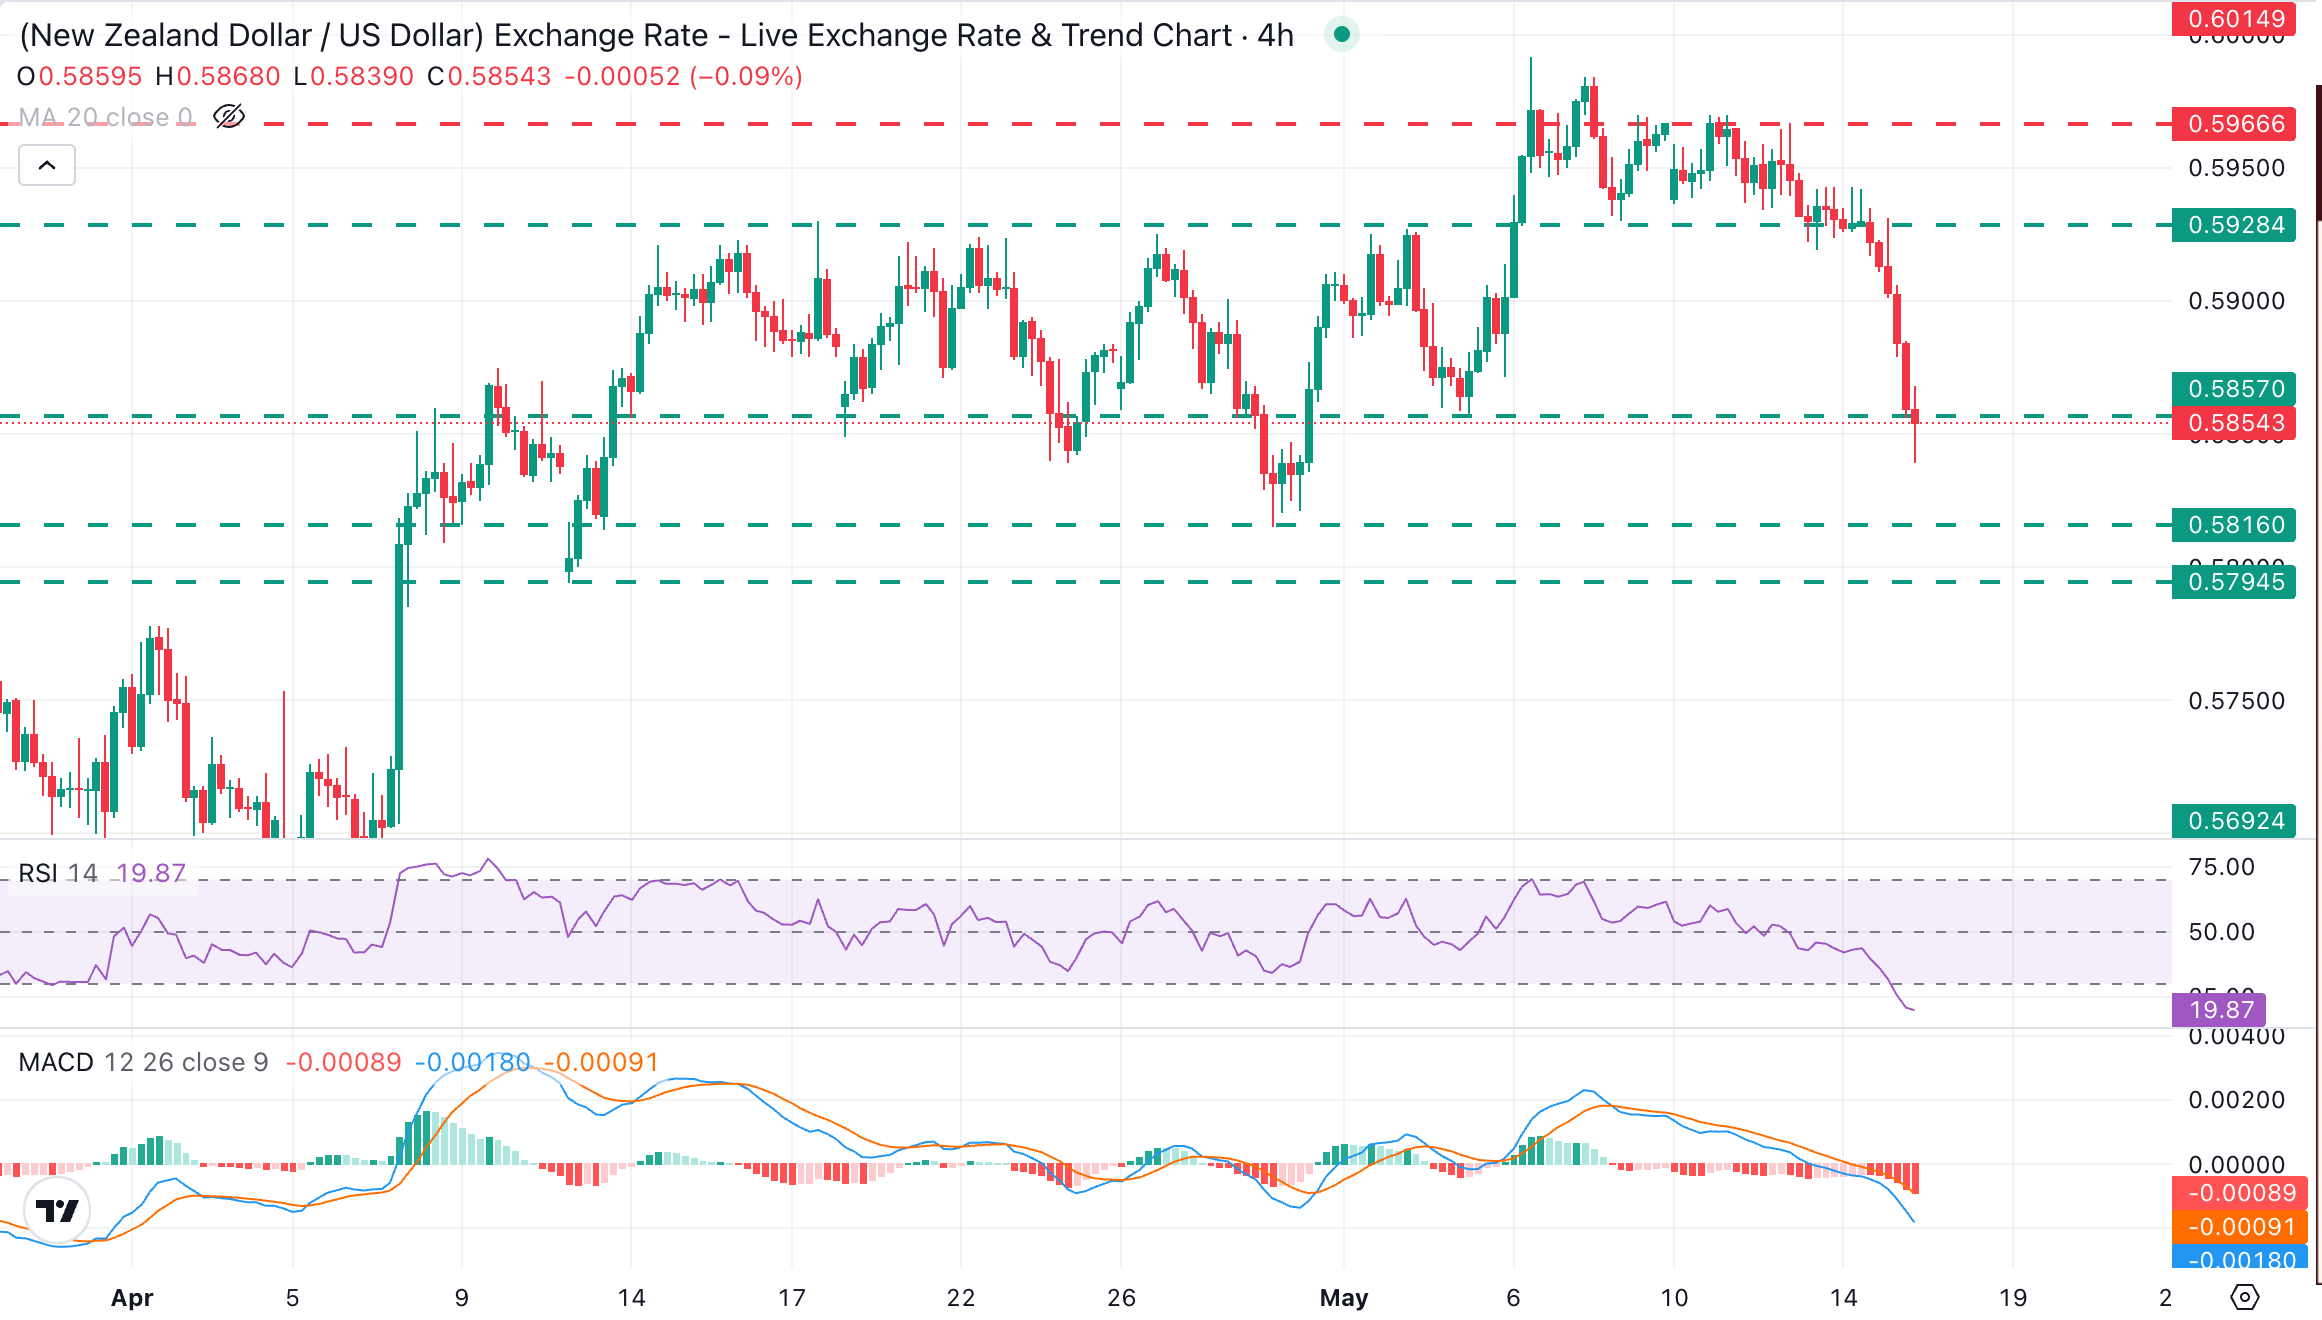
NZD/USD keeps a clear bearish bias after dropping about 2% over the last four days. The 4-hour Relative Strength Index (RSI) has reached oversold territory, and the Moving Average Convergence Divergence (MACD) histogram remains negative, both hinting at persistent downside momentum despite stretched conditions.
With momentum indicators looking overstretched, there is little room for further depreciation, and sellers might be attracted by the late April lows in the 0.5815 area. Further down, the April 13 low, at the 0.5795 area, seems out of reach today.
Upside attempts, on the other hand, are likely to be limited below a previous support area above 0.5920 (May 13 low) ahead of the weekly top, at the 0.5970 area, and May's peak, right above 0.5990.
(The technical analysis of this story was written with the help of an AI tool.)
US Dollar Price Today
The table below shows the percentage change of US Dollar (USD) against listed major currencies today. US Dollar was the strongest against the New Zealand Dollar.
| USD | EUR | GBP | JPY | CAD | AUD | NZD | CHF | |
|---|---|---|---|---|---|---|---|---|
| USD | 0.30% | 0.34% | 0.06% | 0.20% | 0.96% | 1.06% | 0.22% | |
| EUR | -0.30% | 0.02% | -0.24% | -0.12% | 0.65% | 0.78% | -0.07% | |
| GBP | -0.34% | -0.02% | -0.25% | -0.13% | 0.63% | 0.74% | -0.10% | |
| JPY | -0.06% | 0.24% | 0.25% | 0.14% | 0.89% | 1.01% | 0.16% | |
| CAD | -0.20% | 0.12% | 0.13% | -0.14% | 0.74% | 0.84% | 0.02% | |
| AUD | -0.96% | -0.65% | -0.63% | -0.89% | -0.74% | 0.12% | -0.73% | |
| NZD | -1.06% | -0.78% | -0.74% | -1.01% | -0.84% | -0.12% | -0.84% | |
| CHF | -0.22% | 0.07% | 0.10% | -0.16% | -0.02% | 0.73% | 0.84% |
The heat map shows percentage changes of major currencies against each other. The base currency is picked from the left column, while the quote currency is picked from the top row. For example, if you pick the US Dollar from the left column and move along the horizontal line to the Japanese Yen, the percentage change displayed in the box will represent USD (base)/JPY (quote).
Author

Guillermo Alcala
FXStreet
Graduated in Communication Sciences at the Universidad del Pais Vasco and Universiteit van Amsterdam, Guillermo has been working as financial news editor and copywriter in diverse Forex-related firms, like FXStreet and Kantox.
















