|

NZD/USD Price Analysis: Treads water around a psychological level of 0.6200

  • NZD/USD struggles to extend its winning streak amid a bullish momentum on Friday.
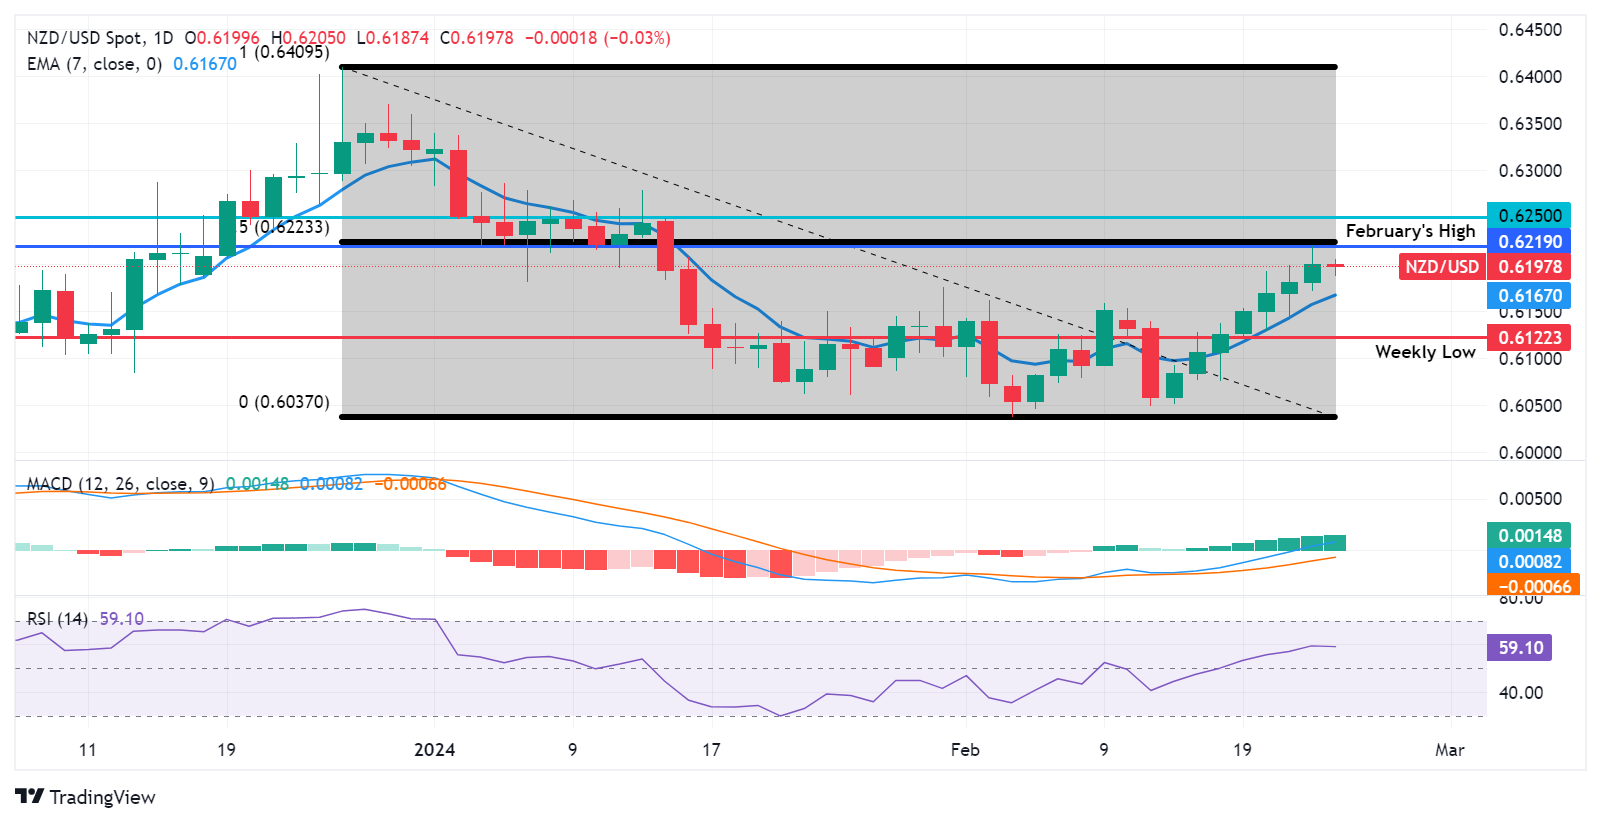
  • The immediate resistance region appears around February’s high at 0.6219 and the 50.0% retracement level of 0.6223.
  • The pair could find the key support region around the seven-day EMA at 0.6167 and the major level of 0.6150.

NZD/USD grapples to extend its winning streak that began on February 14 amid a stable US Dollar. The NZD/USD pair struggles around the psychological level of 0.6200 during the Asian trading hours on Friday.

If the NZD/USD pair surpasses the psychological threshold of 0.6200, it could receive upward support to potentially lead the pair to explore region around the February’s high at 0.6219 and the 50.0% retracement level of 0.6223. A break above this region could exert support for the pair to approach the major resistance of 0.6250 level.

The technical analysis suggests a bullish momentum for the NZD/USD pair. The Moving Average Convergence Divergence (MACD) line is positioned above the centerline, showing divergence above the signal line. Additionally, the 14-day Relative Strength Index (RSI), a lagging indicator, is above the 50 level, suggesting a confirmation of the bullish sentiment.

On the downside, immediate support for the NZD/USD pair is anticipated at the seven-day Exponential Moving Average (EMA) at 0.6167 followed by the major support of 0.6150. A breach below this level could exert downward pressure on the pair, potentially testing the weekly low of 0.6122 to approach the psychological support level of 0.6100.

NZD/USD: Daily Chart
NZD/USD

Overview
Today last price0.62
Today Daily Change0.0000
Today Daily Change %0.00
Today daily open0.62
 
Trends
Daily SMA200.6119
Daily SMA500.6181
Daily SMA1000.6087
Daily SMA2000.6077
 
Levels
Previous Daily High0.6219
Previous Daily Low0.6171
Previous Weekly High0.6153
Previous Weekly Low0.6049
Previous Monthly High0.6339
Previous Monthly Low0.6061
Daily Fibonacci 38.2%0.6201
Daily Fibonacci 61.8%0.6189
Daily Pivot Point S10.6174
Daily Pivot Point S20.6149
Daily Pivot Point S30.6126
Daily Pivot Point R10.6222
Daily Pivot Point R20.6245
Daily Pivot Point R30.627

Author

Akhtar Faruqui

Akhtar Faruqui is a Forex Analyst based in New Delhi, India. With a keen eye for market trends and a passion for dissecting complex financial dynamics, he is dedicated to delivering accurate and insightful Forex news and analysis.


More from Akhtar Faruqui
Share:

Editor's Picks

AUD/USD bulls regain control above 0.6950 amid USD retreat

AUD/USD regains traction and extends the previous day's bounce from the weekly low, aiming for 0.7000 in Asia on Friday. The overnight pullback in US bond yields keeps the US Dollar below an 18-month high, which in turn offers some support to the pair. Meanwhile, hawkish RBA expectations also keep the major underpinned.

USD/JPY holds gains near 158.00 after Japan's weak Household Spending data

USD/JPY clings to gains around 158.00 after data showed on Friday that Japan's Household Spending fell for the ninth straight month, undermining the Japanese Yen. Meanwhile, the US Dollar remains depressed as the overnight fall in US bond yields counters a hawkish Fed and geopolitical uncertainties, could cap any downside in the pair.

Gold retakes $4,200 amid pre-US CPI repositioning

Gold holds firm, revisiting $4,200 on Friday, extending recovery from two-month lows. US Dollar eases in tandem with Oil prices and Treasury yields, awaiting US sentiment data. The tide seems to be turning in favor of Gold, but the daily RSI is still bearish.


Starknet rally tests key breakout amid proposed Layer-1 transition
Starknet (STRK) is up 16% so far on Friday, advancing its steady recovery of nearly 200% since mid-August. The rally aligns with the rising demand for financial anonymity in the cryptocurrency market and the CEO of StarkWare, Eli Ben-Sasson’s proposed transition of Starknet to Layer-1 to achieve quantum security by 2027.
The inflation illusion: How government formulas shape the data
Every month, the government releases a barrage of economic statistics. Employment, inflation, consumer spending, economic growth, and countless other measurements are presented as objective facts that policymakers, investors, and the public can use to understand the economy. But what happens when the methodology used to produce those numbers changes?
The UK 30-year gilt just hit a 1998 high. Is that good or bad for the British Pound?
The yield on the UK's 30-year government bond, or gilt, went through 6% on October 1 for the first time since early 1998, and on Monday the Pound was at its strongest against the Euro since June 2025. The gilt market's 28-year high is mostly someone else's. Since early May, the 30-year gilt yield has risen about 0.15 of a percentage point and the US 30-year about 0.7.















