AUD/USD Price Forecast: Outperforms on cheerful market mood
- AUD/USD jumps to near 0.6980 as upbeat market sentiment lends strength to the Australian Dollar.
- The US Dollar corrects due to a pullback in rally in US bond yields.
- Investors will focus on the US CPI and the Australian employment data for September.

The Australian Dollar (AUD) outperforms its major currency peers on Friday, trading 0.35% higher at around 0.6980 against the US Dollar (USD) during the European session. The Australian currency capitalizes on upbeat market mood, driven by a steep correction in United States (US) Treasury Yields.
Australian Dollar Price Today
The table below shows the percentage change of Australian Dollar (AUD) against listed major currencies today. Australian Dollar was the strongest against the Japanese Yen.
| USD | EUR | GBP | JPY | CAD | AUD | NZD | CHF | |
|---|---|---|---|---|---|---|---|---|
| USD | -0.12% | -0.04% | 0.22% | -0.05% | -0.31% | -0.20% | -0.09% | |
| EUR | 0.12% | 0.08% | 0.36% | 0.07% | -0.18% | -0.06% | 0.01% | |
| GBP | 0.04% | -0.08% | 0.27% | 0.02% | -0.27% | -0.14% | -0.01% | |
| JPY | -0.22% | -0.36% | -0.27% | -0.27% | -0.54% | -0.41% | -0.30% | |
| CAD | 0.05% | -0.07% | -0.02% | 0.27% | -0.29% | -0.16% | -0.02% | |
| AUD | 0.31% | 0.18% | 0.27% | 0.54% | 0.29% | 0.12% | 0.29% | |
| NZD | 0.20% | 0.06% | 0.14% | 0.41% | 0.16% | -0.12% | 0.13% | |
| CHF | 0.09% | -0.01% | 0.00% | 0.30% | 0.02% | -0.29% | -0.13% |
The heat map shows percentage changes of major currencies against each other. The base currency is picked from the left column, while the quote currency is picked from the top row. For example, if you pick the Australian Dollar from the left column and move along the horizontal line to the US Dollar, the percentage change displayed in the box will represent AUD (base)/USD (quote).
At press time, 10-year US bond yields are up 0.17% to near 2.44%. However, they corrected sharply on Thursday after failing to extend rally beyond the two-decade high at 5.36%. S&P 500 futures trade 0.33% higher to near 7,800, indicating an improvement in investors’ risk appetite.
Us Yields retreat as strong 30-year auction caps robust week for treasuries
Analysts at Danske Bank note that “there was a solid decline in the US yields yesterday on the back of another solid US Treasury auction,” with the latest sale focused on the long end of the curve. “This time the 30Y bonds were sold and rounded off a week with solid demand for US Treasuries given the high level for yields,” the bank adds, underscoring sustained investor appetite at current yield levels.
Going forward, major triggers for the US Dollar and the Australian Dollar will be the US Consumer Price Index (CPI) and Australian employment data for September, which will be published next week.
AUD/USD Technical Analysis
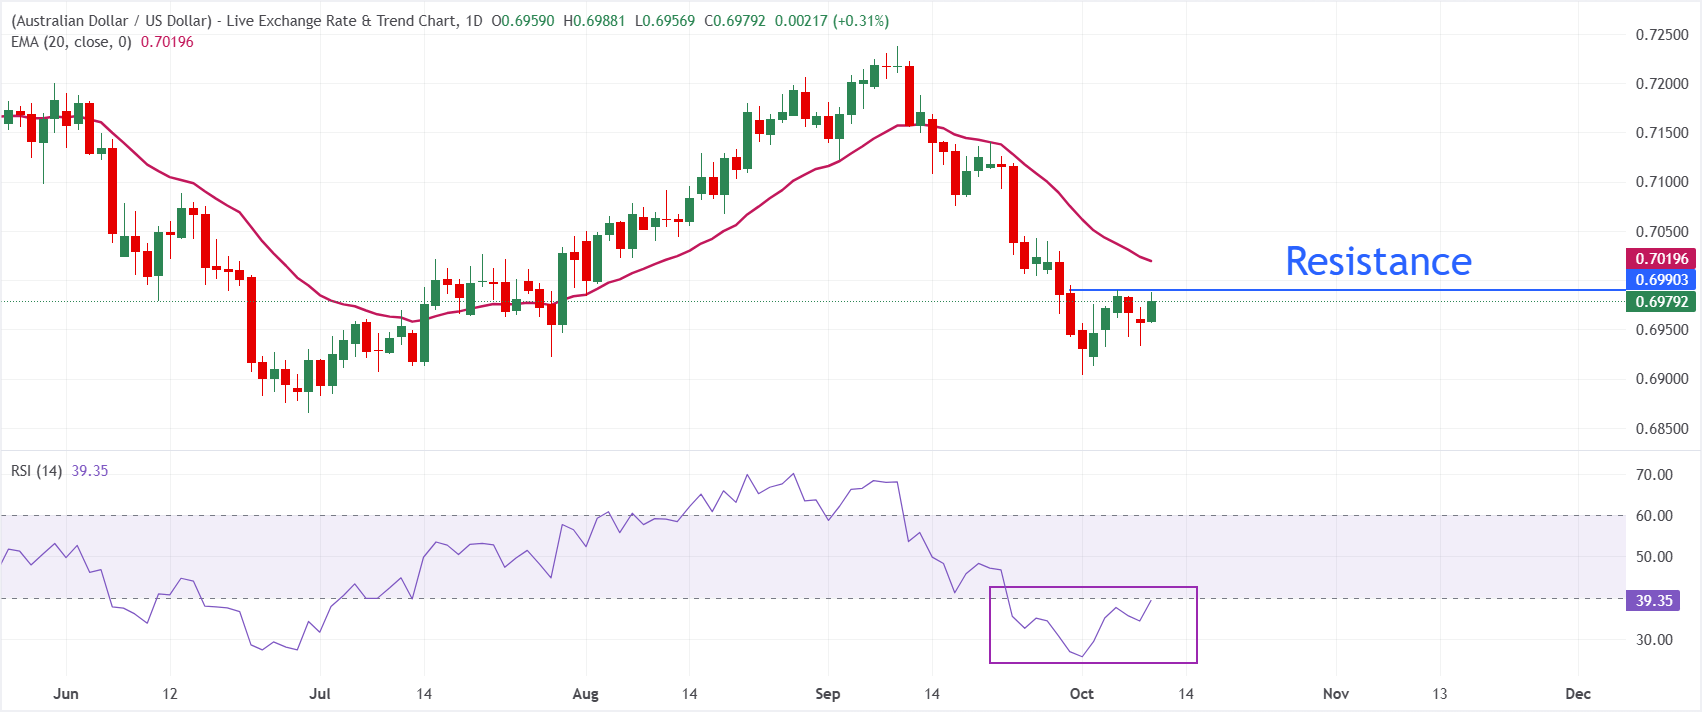
In the daily chart, AUD/USD trades at 0.6980, keeping a bearish near-term tone as spot holds beneath the 20-day Exponential Moving Average (EMA) at 0.7020. The pair remains capped by this short-term EMA, which suggests lingering downside pressure, while the Relative Strength Index (14) near 39 hints at weak but stabilizing momentum after recent oversold readings.
On the topside, initial resistance is the October 6 high at 0.6990 before the 20-day EMA at 0.7020, and a sustained break above this barrier would be needed to ease the current bearish bias and open the way for a stronger recovery. On the downside, the major support for AUD/USD is the October 8 low at 0.6933, followed by the October low at 0.6903.
(The technical analysis of this story was written with the help of an AI tool. Know more.)
US Dollar FAQs
The US Dollar (USD) is the official currency of the United States of America, and the ‘de facto’ currency of a significant number of other countries where it is found in circulation alongside local notes. It is the most heavily traded currency in the world, accounting for over 88% of all global foreign exchange turnover, or an average of $6.6 trillion in transactions per day, according to data from 2022. Following the second world war, the USD took over from the British Pound as the world’s reserve currency. For most of its history, the US Dollar was backed by Gold, until the Bretton Woods Agreement in 1971 when the Gold Standard went away.
The most important single factor impacting on the value of the US Dollar is monetary policy, which is shaped by the Federal Reserve (Fed). The Fed has two mandates: to achieve price stability (control inflation) and foster full employment. Its primary tool to achieve these two goals is by adjusting interest rates. When prices are rising too quickly and inflation is above the Fed’s 2% target, the Fed will raise rates, which helps the USD value. When inflation falls below 2% or the Unemployment Rate is too high, the Fed may lower interest rates, which weighs on the Greenback.
In extreme situations, the Federal Reserve can also print more Dollars and enact quantitative easing (QE). QE is the process by which the Fed substantially increases the flow of credit in a stuck financial system. It is a non-standard policy measure used when credit has dried up because banks will not lend to each other (out of the fear of counterparty default). It is a last resort when simply lowering interest rates is unlikely to achieve the necessary result. It was the Fed’s weapon of choice to combat the credit crunch that occurred during the Great Financial Crisis in 2008. It involves the Fed printing more Dollars and using them to buy US government bonds predominantly from financial institutions. QE usually leads to a weaker US Dollar.
Quantitative tightening (QT) is the reverse process whereby the Federal Reserve stops buying bonds from financial institutions and does not reinvest the principal from the bonds it holds maturing in new purchases. It is usually positive for the US Dollar.
Author

Sagar Dua
FXStreet
Sagar Dua is associated with the financial markets from his college days. Along with pursuing post-graduation in Commerce in 2014, he started his markets training with chart analysis.

















