|

NZD/USD Price Analysis: Persistent bearish forces, oversold RSI hints at a possible rebound

  • NZD/USD plunges, technical outlook remains bearish.
  • RSI nears oversold zone, hinting at potential correction.
  • MACD suggests persistent bearish momentum.

In Monday's session, the NZD/USD pair extended its downward trajectory, depreciating by a significant 0.70% to settle at 0.6030. The technical indicators maintain a bearish stance, signaling a possible continuation of the selling pressure that has characterized recent trading.

The Relative Strength Index (RSI) remains near the oversold area, with a reading of 35 and a descending slope. This indicates a rise in selling pressure, suggesting that the bears continue to exert their influence. However, the proximity to the oversold zone raises the possibility of a corrective bounce if the selling momentum wanes. The Moving Average Convergence Divergence (MACD) histogram, displaying rising red bars, confirms the bearish trend. The histogram's upward movement indicates increasing bearish momentum, while the red color denotes a negative trend.

NZD/USD daily chart

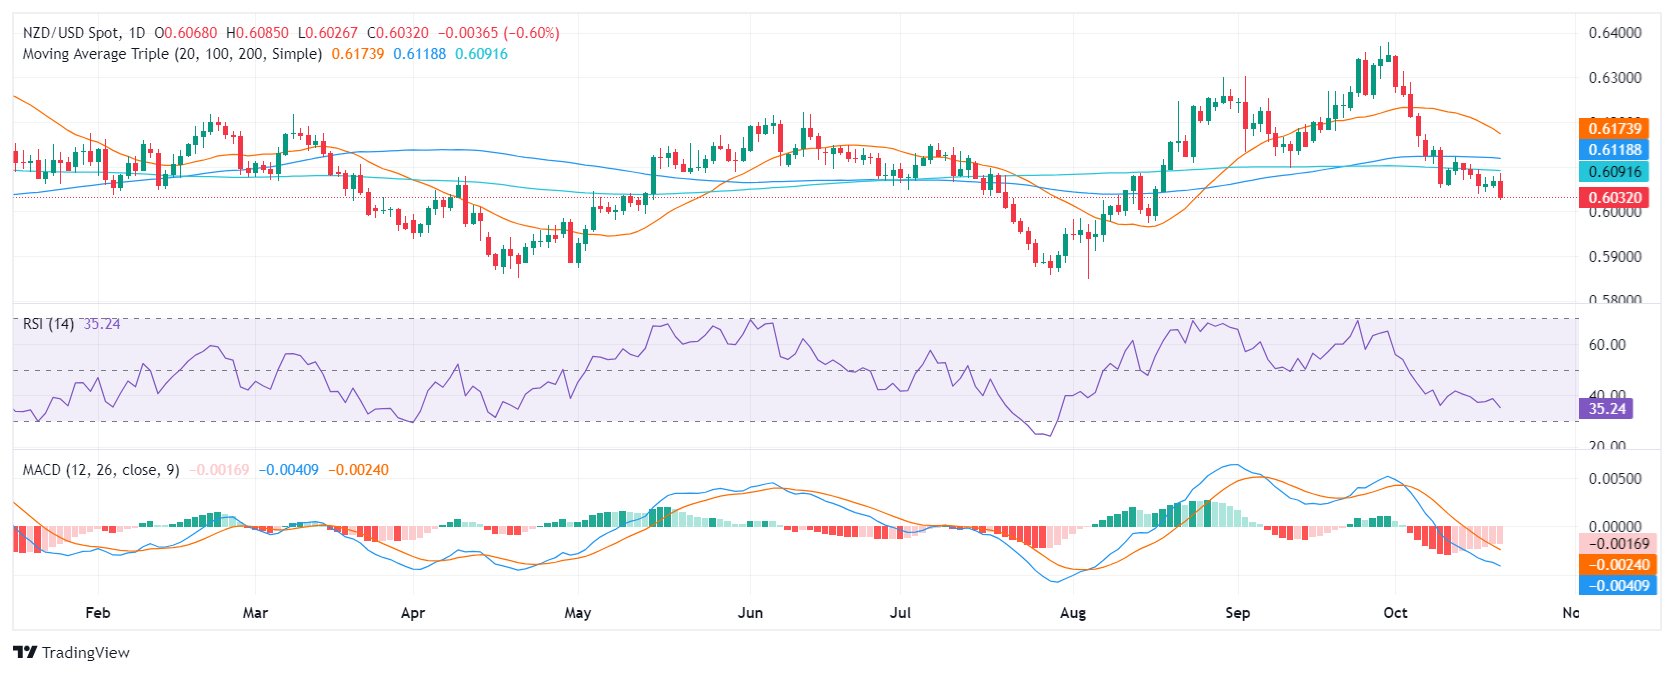
The NZD/USD pair faces significant technical challenges, indicating a bearish outlook. The pair has been trading below key support levels, including the critical 100 and 200-day Simple Moving Averages (SMAs), which currently reside around 0.6100. The pair now stands in lows since mid-August and it may be set for further downside if buyers don’t step in.

If selling continues, the next support is around 0.6000. Conversely, a recovery might see immediate resistance emerging around 0.6060,0.6080 and 0.6100.

Author

Patricio Martín

Patricio is an economist from Argentina passionate about global finance and understanding the daily movements of the markets.

More from Patricio Martín
Share:

Editor's Picks

AUD/USD eyes 0.7150 barrier nine-day EMA

AUD/USD inches higher after registering modest losses in the previous day, trading around 0.7130 during the Asian hours. The technical analysis of the daily chart indicates that the pair is moving sideways within the rectangle pattern, suggesting a consolidation as neither the bulls nor the bears have enough momentum to take control of the market.

USD/JPY trades below 160.00 intervention threshold; bullish bias intact

The USD/JPY pair attracts some sellers during the Asian session amid fears that authorities will step in again to prop up the Japanese Yen. Furthermore, the Israel-Lebanon truce prompts some profit-taking around the US Dollar and exerts downward pressure on the currency pair.

Gold meets contention near $4,420…for now

Gold extends its recovery past the $4,500 mark per troy ounce on Thursday. The yellow metal’s advance comes amid the resurgence of some selling interest around the, improving risk sentiment, and declining US Treasury yields across the curve.

Bitcoin’s massive storm is back: Why the sell-off is far from over

Bitcoin price action over the last few weeks has felt less like a normal, healthy correction and more like a slow grinding crash that continues to wreak havoc on holdings and trading accounts. And everything suggests that the dramatic crash isn’t over.

Nonfarm payrolls: Testing the limits of Fed policy patience

The upcoming nonfarm payrolls report for May will provide the final update on the US labor market before Kevin Warsh attends his first policy meeting as the new Fed Chair later this month.

Recession on paper: What really moves the Canadian Loonie now?

Statistics Canada handed the headline writers a gift and the analysts a headache. Real GDP shrank 0.1% on an annualized basis in the first quarter, and with the fourth quarter of 2025 revised down to a 1.0% contraction, that is two negative quarters in a row, the textbook definition of a technical recession and Canada's first since the pandemic.