|

NZD/USD Price Analysis: Pairs fail to hold 0.6070,bears take the lead

  • NZD/USD fails to preserve the 0.6070 level, plunging to lows seen in mid-May.
  • Pairs are now trading below the critical 20, 100, and 200-day SMA lines, suggesting a bearish outlook.
  • Daily indicators emphasize a mounting selling pressure.

In Tuesday's session, the NZD/USD declined by 0.40% to reach 0.6052 levels. Buyers failed to hold the 0.6070 mark, causing the pair to hit mid-May lows. Notably, the NZD/USD is now below the important Simple Moving Averages (SMA) of 20, 100, and 200 days, indicating a bearish outlook.

Daily technical indicators present a stronger bearish picture. The Relative Strength Index (RSI) stands at 38 after being above 50 last week. Meanwhile, the Moving Average Convergence Divergence (MACD) shows rising red bars, implying an increasing bearish momentum.

NZD/USD daily chart

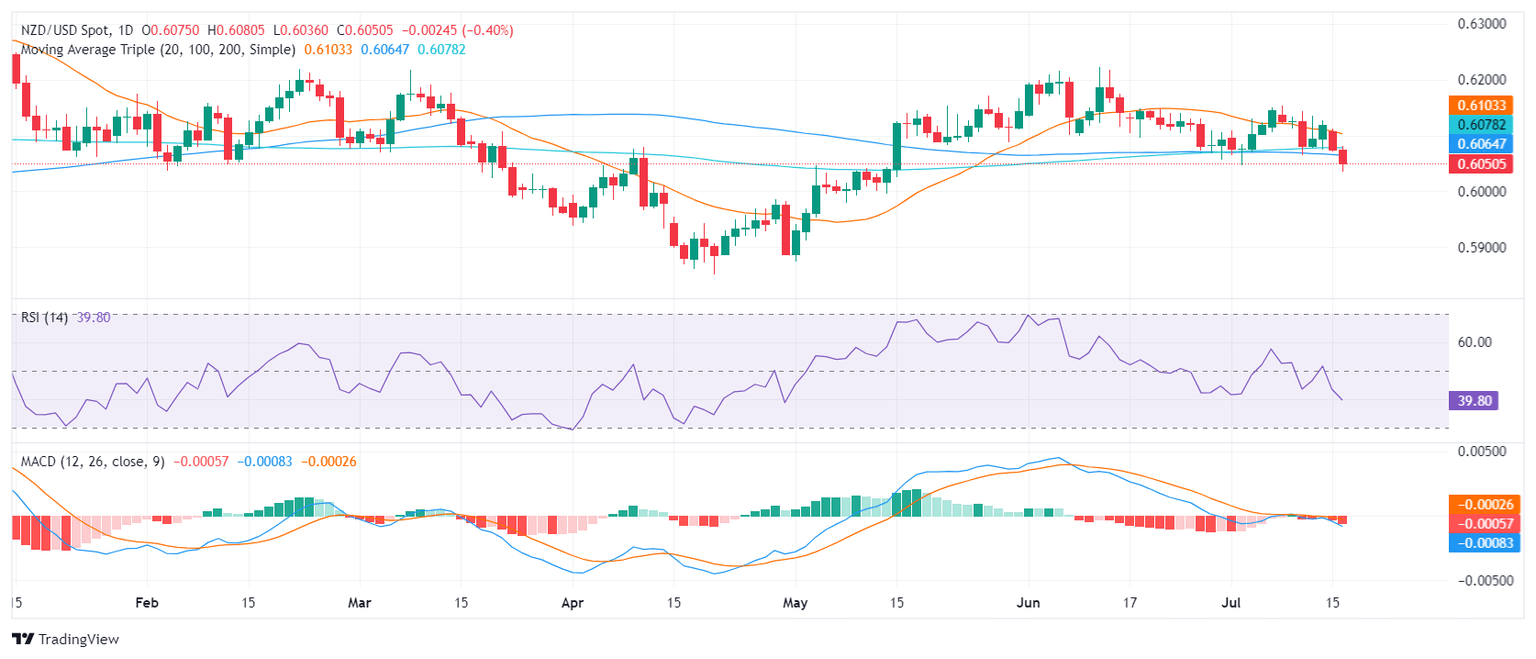
Resistance can now be found at the previous support of 0.6070, followed by the 20-day SMA around 0.6100 and then at 0.6150 and above at 0.6200. Bulls need a decisive close above these levels for a bullish turnaround and to shift the focus upwards.

The downside has a firm support at 0.6050 and then at 0.6030 and adjusting to the bearish shift, a key psychological mark at 0.6000 floats into view. A significant plunge below these levels would confirm the bearish outlook, potentially setting a path for a correction toward lower ranges.

Author

Patricio Martín

Patricio is an economist from Argentina passionate about global finance and understanding the daily movements of the markets.

More from Patricio Martín
Share:

Markets move fast. We move first.

Orange Juice Newsletter brings you expert driven insights - not headlines. Every day on your inbox.

By subscribing you agree to our Terms and conditions.

Editor's Picks

EUR/USD clings to small gains near 1.1750

Following a short-lasting correction in the early European session, EUR/USD regains its traction and clings to moderate gains at around 1.1750 on Monday. Nevertheless, the pair's volatility remains low, with investors awaiting this weeks key US data releases and the ECB policy announcements.

GBP/USD edges higher toward 1.3400 as traders await key data and BoE

GBP/USD reverses its direction and advances toward 1.3400 following a drop to the 1.3350 area earlier in the day. The US Dollar struggles to gather recovery momentum as markets await Tuesday's Nonfarm Payrolls data, while the Pound Sterling holds steady ahead of the BoE policy announcements later in the week.

Gold builds on previous week's gains, approaches $4,350

Gold preserves its bullish momentum after rising more than 2% last week and climbs toward $4,350 on Monday. The precious metal extends its upside as the US Dollar remains on the back foot on growing expectations for a dovish Fed policy outlook next year.

Solana consolidates as spot ETF inflows near $1 billion signal institutional dip-buying

Solana price hovers above $131 at the time of writing on Monday, nearing the upper boundary of a falling wedge pattern, awaiting a decisive breakout. On the institutional side, demand for spot Solana Exchange-Traded Funds remained firm, pushing total assets under management to nearly $1 billion since launch. 

Big week ends with big doubts

The S&P 500 continued to push higher yesterday as the US 2-year yield wavered around the 3.50% mark following a Federal Reserve (Fed) rate cut earlier this week that was ultimately perceived as not that hawkish after all. The cut is especially boosting the non-tech pockets of the market.

Solana Price Forecast: SOL consolidates as spot ETF inflows near $1 billion signal institutional dip-buying

Solana (SOL) price hovers above $131 at the time of writing on Monday, nearing the upper boundary of a falling wedge pattern, awaiting a decisive breakout.