|

NZD/USD Price Analysis: Pair gave up and lost the 0.6070 vital area

  • NZD/USD trudges below the 0.6070 level, marking its worst week since January.
  • The pair closed at 0.6010, indicating a weekly loss of approximately 1.80%.
  • NZD/USD remains under the key SMA of 20, 100, and 200 days, pointing to a sustained bearish bias.

In Friday's session, the NZD/USD sustained its downward momentum, dropping by 0.65% to touch 0.6010. The pair's failure to reclaim the 0.6070 level resulted in a dip to the significant 0.6000 line, consequently closing its worst week since the start of the year with a weekly loss of around 1.80%.

The daily technical indicators also echo this downward trend. The Relative Strength Index (RSI) has decreased further to 36 signaling a continuation of selling pressure. Additionally, the Moving Average Convergence Divergence (MACD) continues to print rising red bars, reaffirming the growing bearish sentiment.

NZD/USD daily chart

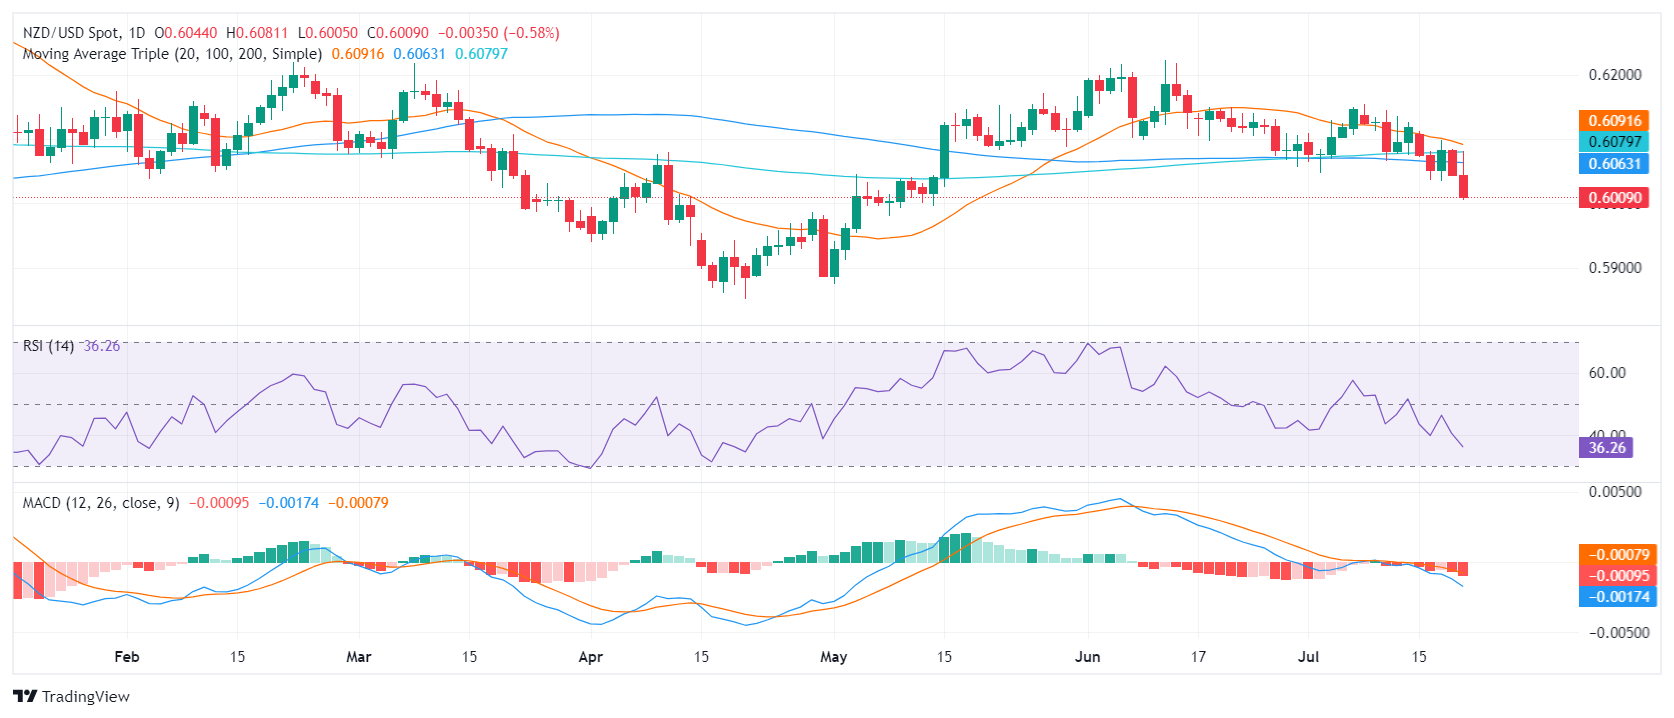
Resistance presently resides at the former support level of 0.6070 and then around 0.6100. On the other hand, strong support is now observed at the formidable 0.6000 line, under which the 0.6450-0.6470 range is visible. Should the bearish tilt maintain its course and lead to a further downturn beneath these levels, it would solidify the bearish narrative.

Author

Patricio Martín

Patricio is an economist from Argentina passionate about global finance and understanding the daily movements of the markets.

More from Patricio Martín
Share:

Markets move fast. We move first.

Orange Juice Newsletter brings you expert driven insights - not headlines. Every day on your inbox.

By subscribing you agree to our Terms and conditions.

Editor's Picks

EUR/USD bears await break below 100-day SMA support near 1.1665 area

The EUR/USD pair attracts heavy selling for the second straight day and dives to a nearly four-week trough, around the 1.1670 region, during the Asian session on Monday. Bearish traders now await a sustained break below the 100-day Simple Moving Average before positioning for an extension of the recent pullback from a three-month top, or levels just above the 1.1800 mark touched on December 24.

GBP/USD falls toward 1.3400 near 50-day EMA

GBP/USD extends its losses for the second successive session, trading around 1.3420 during the Asian hours on Monday. The technical analysis of the daily chart indicates that the 14-day Relative Strength Index at 53 has eased from near overbought, indicating that momentum has cooled while remaining above the midline. RSI holds above 50, keeping a modest bullish bias.

Gold on fire at the start of the week on US-Venezuela tensions

Gold regains upside traction early Monday as flight to safety prevails on Venezuela turmoil. The US Dollar finds strong haven demand, caps Gold’s upside as focus shifts to US jobs data. Gold’s daily technical setup suggests that more upside remains in the offing.

Bulls firmly in control as Bitcoin breaks $93K, Ethereum and Ripple extend gains

Bitcoin, Ethereum, and Ripple extended their rallies on Monday, gaining more than 4%, 6%, and 12%, respectively, in the previous week. The top three cryptocurrencies by market capitalization could continue to outperform, with bulls in control of the momentum.

Economic outlook 2026-2027 in advanced countries: Solidity test

After a year marked by global economic resilience and ending on a note of optimism, 2026 looks promising and could be a year of solid economic performance. In our baseline scenario, we expect most of the supportive factors at work in 2025 to continue to play a role in 2026.

Meme Coins Price Prediction: Dogecoin, Shiba Inu, Pepe rally on Venezuela’s shadow BTC reserve

Meme coins such as Dogecoin, Shiba Inu, and Pepe are leading the cryptocurrency market rally driven by the US cross-border operation to capture Venezuelan President Nicolás Maduro. Dogecoin extends its gain for the fifth consecutive day while SHIB and PEPE take a pause.