NZD/USD Price Analysis: Fades bounce off 0.6090 support confluence ahead of China/US PMIs
- NZD/USD fails to defend the week-start gap towards the north.
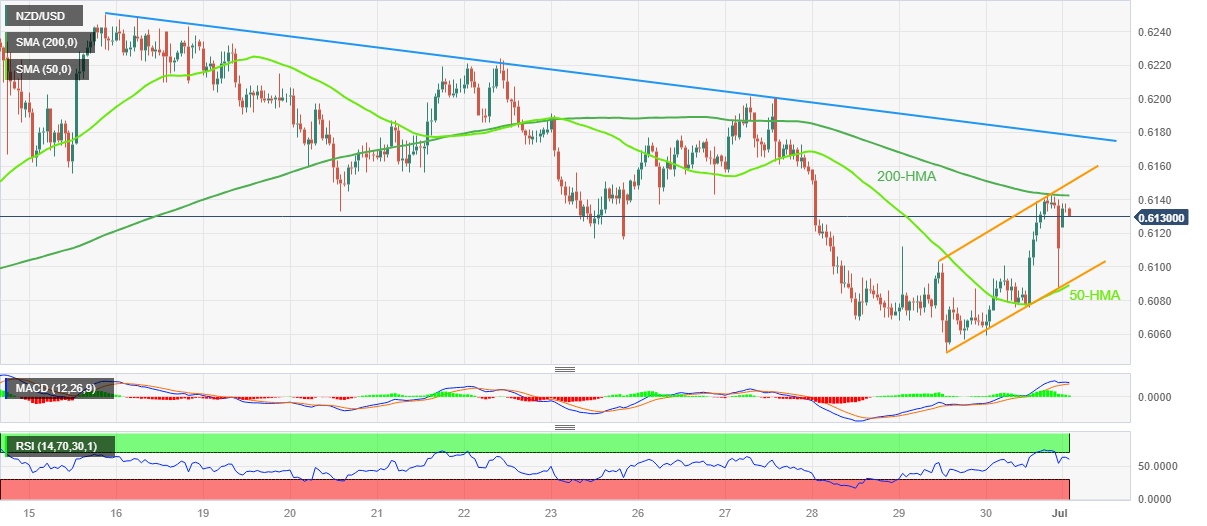
- 200-HMA, top line of immediate bullish channel and a fortnight-old falling trend line challenge Kiwi buyers.
- Convergence of 50-HMA, channel support puts a floor under the price.
- China Caixin Manufacturing PMI, US ISM Manufacturing for June eyed for clear directions.

NZD/USD retreats from intraday high to around 0.6135 as the pair traders await the top-tier PMIs from China and the US amid the early hours of Monday’s Asian session. In doing so, the Kiwi pair consolidates intraday gains after posting an upside gap to begin the trading week, not to forget the two consecutive weekly and quarterly falls in the last.
The Kiwi pair’s latest pullback could be linked to the inability to cross the 200-Hour Moving Average (HMA), as well as the RSI (14) line’s retreat from the overbought territory. The same join the impending bear cross on the MACD indicator to lure the intraday sellers.
With this, the NZD/USD bears may aim for the 0.6100 round figure during the pair’s further declines. However, a convergence of the 50-HMA and the bottom line of a two-day-old rising trend channel, around 0.6090 by the press time, appears a tough nut to crack for the sellers.
In a case where the quote drops below 0.6090, the odds of witnessing a slump toward the previous weekly low of 0.6050 and then to the monthly bottom surrounding 0.5990 can’t be ruled out.
On the flip side, the NZD/USD pair’s rise past the 200-HMA, near 0.6145 at the latest, isn’t an open invitation to the bulls as the top line of the stated bullish channel, close to 0.6150, can test the pair’s further advances.
Even if the quote rises past 0.6150, a downward-sloping resistance line from June 15, near 0.6180 will act as the final defense of the bears.
NZD/USD: Hourly chart
Trend: Limited downside expected
Author

Anil Panchal
FXStreet
Anil Panchal has nearly 15 years of experience in tracking financial markets. With a keen interest in macroeconomics, Anil aptly tracks global news/updates and stays well-informed about the global financial moves and their implications.














