|

NZD/USD Price Analysis: Bears take a breather, yet maintain a clear domination

  • NZD/USD slightly rebounds, hovering near the 0.5900 mark, but remains under a clear bearish influence.
  • The pair lost more than 4% in July, underscoring a strong bearish outlook.
  • The 0.5850 area is the last barrier against the sellers.

In Friday's session, the NZD/USD took a slight break from its continual downward trajectory, mildly rebounding to 0.5890. This brief respite comes after a six-day losing streak that led to a significant bearish turnaround for the currency pair. The overall picture still reveals a strongly bearish influence, given the pair lost over 4% in July, and the bearish crossover of the 20-day Simple Moving Average (SMA) at 0.6050 with the 100-day SMA, which might just inspire the bears further.

The daily technical indicators continue to signal a bearish trend. The Relative Strength Index (RSI) stands at 24, nestled firmly within oversold territory, which indicates intense selling pressure. Additionally, the Moving Average Convergence Divergence (MACD) with its flat red bars lends further support to a bearish outlook. As the RSI descends further into the oversold region, there may be a possible corrective momentum on the horizon.

NZD/USD daily chart

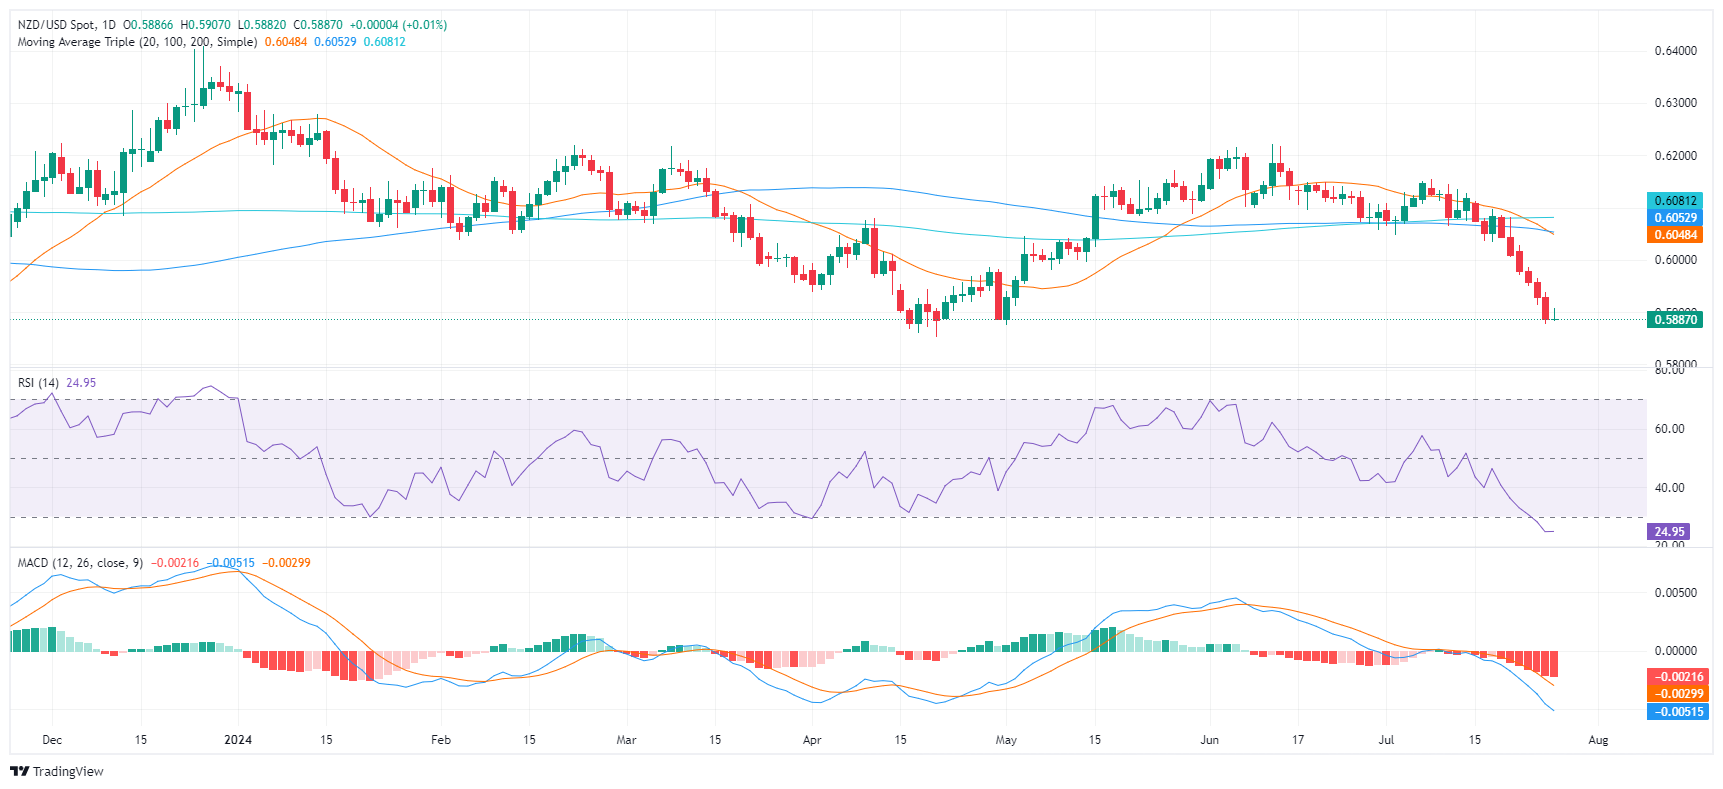
From a daily chart perspective, strong support is noticed at the 0.5880 level and slightly below that at May lows around 0.5850. On the flip side, resistance can now be spotted at the former support level of 0.6000, followed by 0.6050.

Author

Patricio Martín

Patricio is an economist from Argentina passionate about global finance and understanding the daily movements of the markets.

More from Patricio Martín
Share:

Markets move fast. We move first.

Orange Juice Newsletter brings you expert driven insights - not headlines. Every day on your inbox.

By subscribing you agree to our Terms and conditions.

Editor's Picks

EUR/USD runs past 1.1730 after tepid US macroeconomic figures

EUR/USD extends its gains and trades above 1.1730 in the American session on Thursday. The US Dollar resumed its decline, following much weaker-than-expected Initial Jobless Claims. Market players bet for additional rate cuts despite a mildly hawkish Fed.

GBP/USD ticks north beyond 1.3400 after US employment data

GBP/USD ticks beyond 1.3400 in the American session on Thursday, as the US Dollar is back on the losing side, following worse-than-anticipated US employment-related figures. The US Federal Reserve delivered a rate cut at its December meeting, in line with the market’s expectations.

Gold on its way to retest record highs

Broad US Dollar weakness helps the bright metal to extend weekly gains. The XAU/USD pair trades above $4,250, its highest for the week and not far from its record high in the $4,380 region. The Greenback came under selling pressure on Wednesday following the Federal Reserve's monetary policy announcement, further pressured on Thursday by softer-than-anticipated United States employment data. 

Solana dips as hawkish Fed cuts dampen market sentiment

Solana price is trading below $130 on Thursday, after being rejected at the upper boundary of its falling wedge pattern. The broader market weakness following the Federal Reserve’s hawkish rate cut has added to downside momentum.

FOMC Summary: A split cut and a clear shift toward caution

The Federal Reserve (Fed) went ahead with a 25 basis points rate cut, taking the target range to 3.50–3.75%. But the tone around the decision mattered just as much as the move.

Solana dips as hawkish Fed cuts dampen market sentiment
Solana (SOL) price is trading below $130 at the time of writing on Thursday, after being rejected at the upper boundary of its falling wedge pattern. The broader market weakness following the Federal Reserve’s hawkish rate cut has added to downside momentum.