|

NZD/JPY Price Analysis: Trades at fresh five-week-lows around 83.40s

  • The NZD/JPY collapses more than 1.50% on Tuesday.
  • China’s Covid-19 woes triggered a flight to safe-haven assets, and the JPY rose.
  • NZD/JPY Price Forecast: Mixed signals between price action and market sentiment suggest that the NZD/JPY is tilted to the downside.

The New Zealand dollar follows the footsteps of the risk-sensitive currencies battered on Tuesday, amid increasing concerns that China’s coronavirus outbreak and its zero-covid policy create a cocktail that threatens to disrupt the supply chain, spurring elevated prices. Those factors weighed on market sentiment, propelling further yen upside. At the time of writing, the NZD/JPY is trading at 83.36.

Additionally, the Ukraine-Russia hostilities remain and escalated. According to Reuters, Gazprom halted gas deliveries to Bulgaria, while Polish firm PGNIG said Russia would stop gas deliveries starting April 27th.

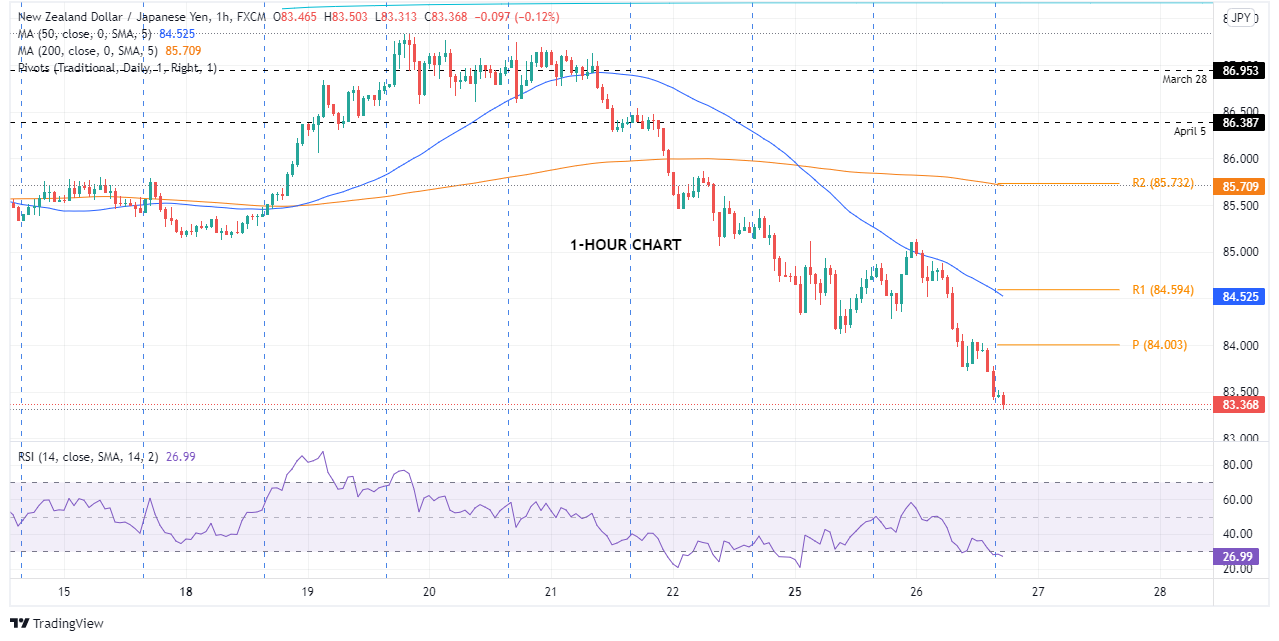
On Tuesday, the NZD/JPY began the session around 84.73, shy of the daily highs, and dipped towards 84.50 due to negative sentiment in the markets. Nevertheless, the PBoC cutting RRR 100 bps caused a bounce towards the 85.00-14 area, retreating afterward towards the daily low around 83.40, on a negative sentiment shift.

NZD/JPY Price Forecast: Technical outlook

From a technical perspective in the daily chart, the NZD/JPY pair is upward biased. However, the market is being driven by market sentiment, and given that the NZD/JPY broke below March’s 31 low at 84.24, it opened the door for a fall towards October 2021 highs around 82.50.

With that said, the NZD/JPY first support would be the 83.00 figure. A breach of the latter would expose the S1 daily pivot at 82.56, followed by October 2021 highs near 82.50. Once cleared, the next line of defense downwards would be the S2 daily pivot at 82.27.

Key Technical Levels

NZD/JPY

Overview
Today last price83.36
Today Daily Change-1.33
Today Daily Change %-1.57
Today daily open84.8
 
Trends
Daily SMA2085.52
Daily SMA5082.09
Daily SMA10079.69
Daily SMA20078.99
 
Levels
Previous Daily High85.46
Previous Daily Low84.13
Previous Weekly High87.35
Previous Weekly Low85.06
Previous Monthly High86.96
Previous Monthly Low77.39
Daily Fibonacci 38.2%84.64
Daily Fibonacci 61.8%84.95
Daily Pivot Point S184.13
Daily Pivot Point S283.46
Daily Pivot Point S382.79
Daily Pivot Point R185.47
Daily Pivot Point R286.14
Daily Pivot Point R386.81

Author

Christian Borjon Valencia

Christian Borjon began his career as a retail trader in 2010, mainly focused on technical analysis and strategies around it. He started as a swing trader, as he used to work in another industry unrelated to the financial markets.

More from Christian Borjon Valencia
Share:

Markets move fast. We move first.

Orange Juice Newsletter brings you expert driven insights - not headlines. Every day on your inbox.

By subscribing you agree to our Terms and conditions.

Editor's Picks

EUR/USD edges above 1.1750 due to ECB-Fed policy divergence

EUR/USD has recovered its recent losses registered in the previous session, trading around 1.1760 during the Asian hours on Friday. Traders will likely observe Germany’s Manufacturing Purchasing Managers’ Index data later in the day.

GBP/USD gathers strength above 1.3450 on Fed rate cut bets, BoE's gradual policy path

The GBP/USD pair gathers strength to around 1.3480 during the early Asian session on Friday. Expectations of the US Federal Reserve rate cuts this year weigh on the US Dollar against the Pound Sterling. Philadelphia Fed President Anna Paulson is set to speak later on the weekend. 

Gold climbs to near $4,350 on Fed rate cut bets, geopolitical risks

Gold price rises to near $4,345 during the early Asian session on Friday. Gold finished 2025 with a significant rally, achieving an annual gain of around 65%, its biggest annual gain since 1979. The rally of the precious metal is bolstered by the prospect of further US interest rate cuts in 2026 and safe-haven flows.

Bitcoin, Ethereum and Ripple enter the New Year with breakout hopes

Bitcoin, Ethereum, and Ripple entered the new year trading at key technical levels on Friday, as traders seek fresh directional cues in January. With BTC locked in a tight range, ETH is approaching its 50-day Exponential Moving Average, while XRP is nearing resistance. A clear breakout across these top three cryptocurrencies could help define market momentum in the opening weeks of the year.

Economic outlook 2026-2027 in advanced countries: Solidity test

After a year marked by global economic resilience and ending on a note of optimism, 2026 looks promising and could be a year of solid economic performance. In our baseline scenario, we expect most of the supportive factors at work in 2025 to continue to play a role in 2026.

Crypto market outlook for 2026

Year 2025 was volatile, as crypto often is.  Among positive catalysts were favourable regulatory changes in the U.S., rise of Digital Asset Treasuries (DAT), adoption of AI and tokenization of Real-World-Assets (RWA).